在Matplotlib中,如何将文件夹中提供的shapefile(如下所示)叠加在图表外部的右上角位置。 
被banderkat引用的代码:
import matplotlib.pyplot as plt
import Image
import numpy as np

im = Image.open('Jbc4j.jpg')
width = im.size[0]
height = im.size[1]

# We need a float array between 0-1, rather than
# a uint8 array between 0-255
im = np.array(im).astype(np.float) / 255

a = np.random.randint(0,100,100)
b = range(100)
fig = plt.figure(1,figsize=(5, 7), dpi=80, facecolor='w')
ax = fig.add_subplot(111)
ax.scatter(a,b)
fig.canvas.draw()

# With newer (1.0) versions of matplotlib, you can
# use the "zorder" kwarg to make the image overlay
# the plot, rather than hide behind it... (e.g. zorder=10)
fig.figimage(im, fig.bbox.xmax - width, fig.bbox.ymax - height, zorder=0)

# (Saving with the same dpi as the screen default to
#  avoid displacing the logo image)
fig.savefig('temp.png', dpi=80)

plt.show()
zorder=1 将把图像置于顶部。
其他有用的参考资料:
import numpy as np
import matplotlib.pyplot as plt
from mpl_toolkits.basemap import Basemap
import matplotlib.gridspec as gridspec
def plotShapeFile():
# Lambert Conformal Conic map.
m = Basemap(llcrnrlon=-100.,llcrnrlat=0.,urcrnrlon=-20.,urcrnrlat=57.,
projection='lcc',lat_1=20.,lat_2=40.,lon_0=-60.,
resolution ='l',area_thresh=1000.)
# read shapefile.
shp_info = m.readshapefile('C:/basemap-1.0.6/basemap-1.0.6/examples/huralll020','hurrtracks',drawbounds=False)
# find names of storms that reached Cat 4.
names = []
for shapedict in m.hurrtracks_info:
cat = shapedict['CATEGORY']
name = shapedict['NAME']
if cat in ['H4','H5'] and name not in names:
# only use named storms.
if name != 'NOT NAMED': names.append(name)
# plot tracks of those storms.
for shapedict,shape in zip(m.hurrtracks_info,m.hurrtracks):
name = shapedict['NAME']
cat = shapedict['CATEGORY']
if name in names:
xx,yy = zip(*shape)
# show part of track where storm > Cat 4 as thick red.
if cat in ['H4','H5']:
m.plot(xx,yy,linewidth=1.5,color='r')
elif cat in ['H1','H2','H3']:
m.plot(xx,yy,color='k')
# draw coastlines, meridians and parallels.
m.drawcoastlines()
m.drawcountries()
m.drawmapboundary(fill_color='#99ffff')
m.fillcontinents(color='#cc9966',lake_color='#99ffff')
m.drawparallels(np.arange(10,70,20),labels=[1,1,0,0])
m.drawmeridians(np.arange(-100,0,20),labels=[0,0,0,1])
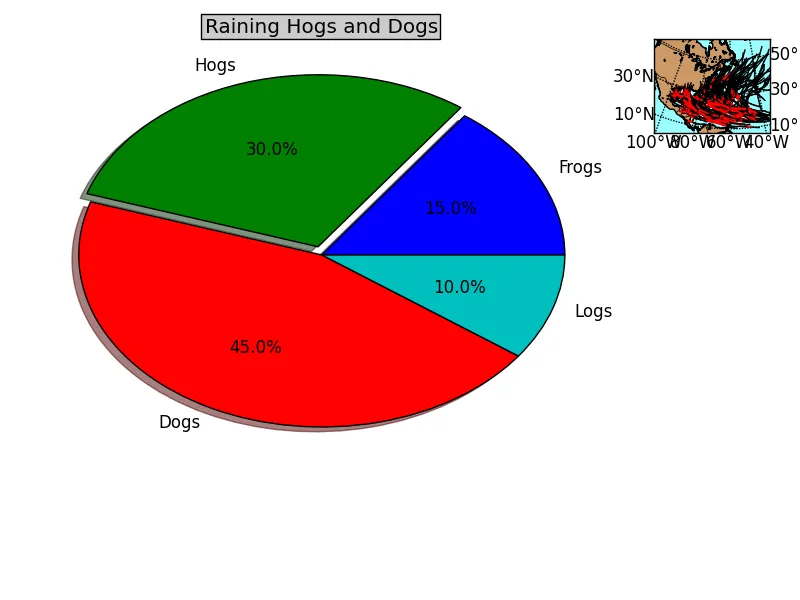
if __name__ == '__main__':
fig=plt.figure()
plt.subplots_adjust(wspace=0.001, hspace=0.001)
ax1=plt.subplot2grid((5,5), (0,0), colspan=4, rowspan=4)
labels = 'Frogs', 'Hogs', 'Dogs', 'Logs'
fracs = [15,30,45, 10]
explode=(0, 0.05, 0, 0)
p1,t1,at1 = plt.pie(fracs, explode=explode, labels=labels, autopct='%1.1f%%', shadow=True)
plt.title('Raining Hogs and Dogs', bbox={'facecolor':'0.8', 'pad':5})
ax2=plt.subplot2grid((5,5), (0,4), colspan=1, rowspan=1)
#draw shapeFile on the current active axes, i.e. ax2
plotShapeFile()
plt.tight_layout()
plt.show()
http://sourceforge.net/projects/matplotlib/files/matplotlib-toolkits/basemap-1.0.6/ http://matplotlib.org/basemap/users/examples.html
输出: