Python Matplotlib Basemap如何在地图上叠加小图片?

27

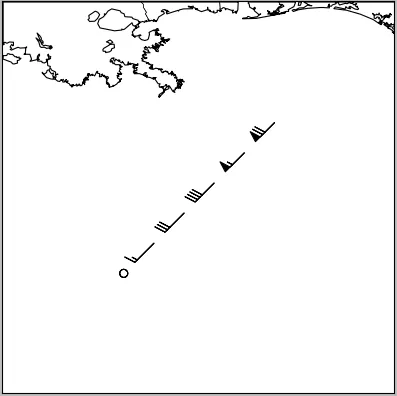
我正在将一架飞机的数据在地图上绘制,并希望在最新数据点的坐标处插入这张75像素x 29像素的PNG飞机图片。

airplane

据我所知和了解,pyplot.imshow()是实现此目的的最佳方法。不过,在第一步中,我卡壳了,即使是让这张图片显示出来。使用普通的绘图而不是Basemap时,使用imshow很容易让图像出现,但是当使用Basemap时,我无法让它显示出来。请参见示例代码。

如果我可以在地图上显示图像,我会假设,通过试错,可以使用imshow()extent属性设置其位置和一些适当的尺寸,其中绘图坐标从地图坐标转换为x,y = m(lons,lats)

以下是示例代码(要尝试它,您可能需要下载上面的飞机图片)。

from matplotlib import pyplot as plt
from mpl_toolkits.basemap import Basemap
import Image
from numpy import arange

lats = arange(26,29,0.5)
lons = arange(-90,-87,0.5)

m = Basemap(projection='cyl',llcrnrlon=min(lons)-2,llcrnrlat=min(lats)-2,
            urcrnrlon=max(lons)+2,urcrnrlat=max(lats)+2,resolution='i')

x,y = m(lons,lats)
u,v, = arange(0,51,10),arange(0,51,10)
barbs = m.barbs(x,y,u,v)
m.drawcoastlines(); m.drawcountries(); m.drawstates()

img = Image.open('c130j_75px.png')
im = plt.imshow(img, extent=(x[-1],x[-1]+50000,y[-1],y[-1]+50000))
plt.show()

这是最终的图片,完全看不到飞机的踪迹。我尝试使用 extent 来调整大小,可能是我把它调得太小了,但无济于事。我还尝试将 zorder=10,但也没有成功。任何帮助都将不胜感激。

result

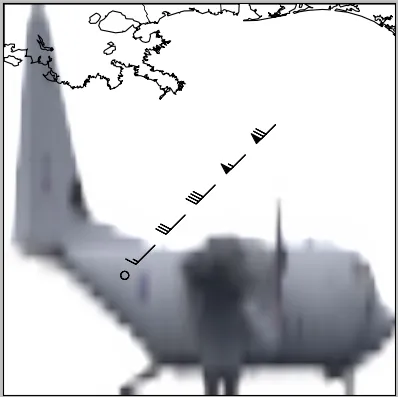
更新:现在我可以通过使用 m.imshow 而非 plt.imshow 将图像至少显示出来,因为前者传递了地图的轴实例,但 extent 参数似乎对图像的尺寸没有影响,因为它始终填满整个绘图区域,无论我将 extent 的尺寸设置得多小,甚至如果我将其设置为零。如何适当地缩放飞机图像并将其定位在最后一个数据点附近?

im = m.imshow(img, extent=(x[-1],x[-1]+5,y[-1],y[-1]+2))

result2

2个回答

26
实际上,您需要使用matplotlib的一个较少文档化的功能:matplotlib.offsetbox模块。这里有一个示例:http://matplotlib.sourceforge.net/trunk-docs/examples/pylab_examples/demo_annotation_box.html 在您的情况下,您需要执行以下操作:
import matplotlib.pyplot as plt
import numpy as np
import Image

from mpl_toolkits.basemap import Basemap
from matplotlib.offsetbox import OffsetImage, AnnotationBbox

# Set up the basemap and plot the markers.
lats = np.arange(26, 29, 0.5)
lons = np.arange(-90, -87, 0.5)

m = Basemap(projection='cyl',
            llcrnrlon=min(lons) - 2, llcrnrlat=min(lats) - 2,
            urcrnrlon=max(lons) + 2, urcrnrlat=max(lats) + 2,
            resolution='i')

x,y = m(lons,lats)
u,v, = np.arange(0,51,10), np.arange(0,51,10)
barbs = m.barbs(x,y,u,v)

m.drawcoastlines()
m.drawcountries()
m.drawstates()

# Add the plane marker at the last point.
plane = np.array(Image.open('plane.jpg'))
im = OffsetImage(plane, zoom=1)
ab = AnnotationBbox(im, (x[-1],y[-1]), xycoords='data', frameon=False)

# Get the axes object from the basemap and add the AnnotationBbox artist
m._check_ax().add_artist(ab)

plt.show()

enter image description here

这样做的好处是,平面坐标系保持不变,并且在缩放时相对于图形大小保持相同的大小。

我正在尝试使用matplotlib.animation包中的此方法来在每帧中动画多个图像,但是我收到了错误消息AttributeError: 'list' object has no attribute 'axes'。您推荐使用这种方法进行动画吗? - ryanjdillon
未能按时编辑,但我想改变问题的表述:你推荐一种使用该方法来为每帧制作多个图像动画的方式吗?谢谢Joe。 - ryanjdillon
1
对于任何想要绘制多个图像并控制它们的 zorder 的人,可以使用方法 matplotlib.offsetbox.AnnotationBbox.set_zorder - 0 _
以防有人遇到同样的问题,导入_Image_时我不得不安装 pillow 这个包,然后使用from PIL import Image进行导入。 - lanadaquenada

14

使用basemap时,通常只需使用常规的pyplot样式命令,如果您先使用地图实例将坐标转换,则可以轻松实现。在这种情况下,您只需使用以下方式将范围转换为uv坐标:

x0, y0 = m(x[-1], y[-1])
x1, y1 = m(x[-1] + 0.5, y[-1] + 0.5)

然后你随后将能够执行:

im = plt.imshow(img, extent=(x0, x1, y0, y1))

我完整的解决方案如下:

import matplotlib.pyplot as plt
from mpl_toolkits.basemap import Basemap
import numpy as np


lats = np.arange(26, 29, 0.5)
lons = np.arange(-90, -87, 0.5)

m = Basemap(projection='cyl', llcrnrlon=min(lons)-2, llcrnrlat=min(lats)-2,
            urcrnrlon=max(lons)+2, urcrnrlat=max(lats)+2, resolution='h')

x, y = m(lons,lats)
u, v = np.arange(0, 51, 10), np.arange(0, 51, 10)
barbs = m.barbs(x, y, u, v)

m.drawcoastlines()
m.fillcontinents()

x_size, y_size = 0.8, 0.4
x0, y0 = m(x[-1] - x_size/2., y[-1] - y_size/2.)
x1, y1 = m(x[-1] + x_size/2., y[-1] + y_size/2.)
im = plt.imshow(plt.imread('mslr86.png'), extent=(x0, x1, y0, y1))

plt.show()

这会生成一个看起来像enter image description here的图片。

更新:如果你想让图片保持固定大小,与缩放无关,请参考Joe的答案。


网页内容由stack overflow 提供, 点击上面的
可以查看英文原文,
原文链接