有没有办法在matplotlib中插入一个比例尺来显示长度比例?就像我附上的那个一样。
或者有没有自动测量和显示距离的想法(不是手动绘制箭头并写入距离!)?
谢谢 :)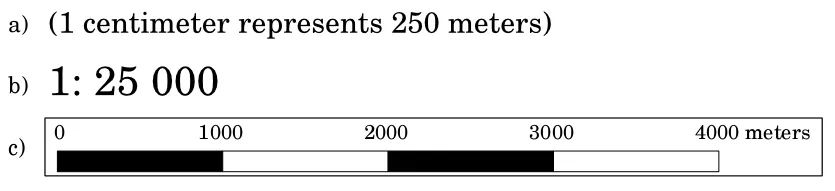
有没有办法在matplotlib中插入一个比例尺来显示长度比例?就像我附上的那个一样。
或者有没有自动测量和显示距离的想法(不是手动绘制箭头并写入距离!)?
谢谢 :)
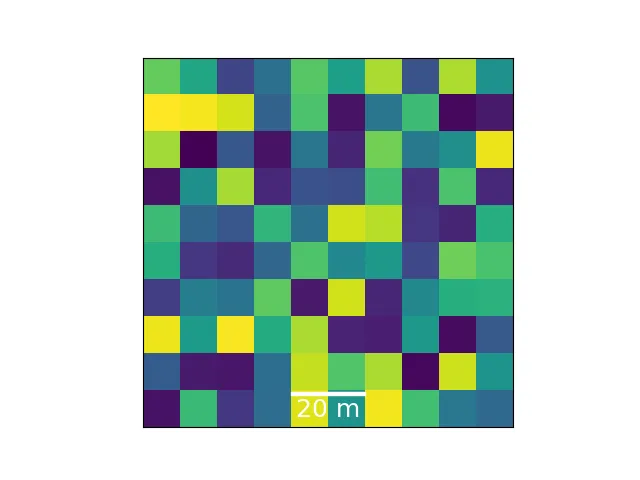
在Matplotlib中已经存在一个与比例尺相关的类,叫做AnchoredSizeBar。在下面的示例中,使用AnchoredSizeBar向图像(或100x100米范围内的地图)添加了一个比例尺。
import numpy as np
import matplotlib.pyplot as plt
from mpl_toolkits.axes_grid1.anchored_artists import AnchoredSizeBar
import matplotlib.font_manager as fm
fontprops = fm.FontProperties(size=18)
fig, ax = plt.subplots()
ax.imshow(np.random.random((10,10)),extent=[0,100,0,100])
Extent定义了图像水平和垂直值的最大和最小值。
scalebar = AnchoredSizeBar(ax.transData,
                           20, '20 m', 'lower center',
                           pad=0.1,
                           color='white',
                           frameon=False,
                           size_vertical=1,
                           fontproperties=fontprops)

ax.add_artist(scalebar)
AnchoredSizeBar的前四个参数是坐标系的变换对象、比例尺长度、标签和位置。更多可选参数可以改变布局,详见文档。
ax.set_yticks([])
ax.set_xticks([])
 的比例尺。
的比例尺。我建议你尝试使用 matplotlib-scalebar 包。(比如像您提供的示例 c.)
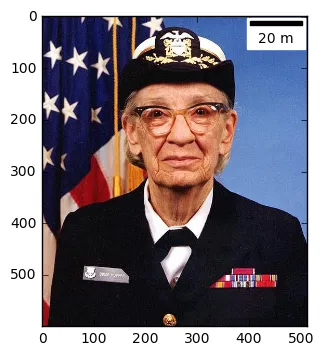
假设您正在绘制一张地图图像,使用imshow或类似的函数,并且您知道像素宽度/单元格大小(地图图像上一个像素的实际大小),则可以自动创建比例尺:
以下示例直接从PyPi matplotlib-scalebar包页面中摘取,以便完整呈现:
import matplotlib.pyplot as plt
import matplotlib.cbook as cbook
from matplotlib_scalebar.scalebar import ScaleBar

plt.figure()
image = plt.imread(cbook.get_sample_data('grace_hopper.png'))
plt.imshow(image)
scalebar = ScaleBar(0.2) # 1 pixel = 0.2 meter
plt.gca().add_artist(scalebar)
plt.show()