如何在matplotlib的图表角落插入小图片?

40

我想要的非常简单:我有一个名为“logo.png”的小图像文件,我想在绘图的左上角显示它。但是在matplotlib示例库中找不到任何关于此的示例。

我正在使用Django,我的代码类似于:

def get_bars(request)
    ...
    fig = Figure(facecolor='#F0F0F0',figsize=(4.6,4))
    ...
    ax1 = fig.add_subplot(111,ylabel="Valeur",xlabel="Code",autoscale_on=True)
    ax1.bar(ind,values,width=width, color='#FFCC00',edgecolor='#B33600',linewidth=1)
    ...
    canvas = FigureCanvas(fig)
    response = HttpResponse(content_type='image/png')
    canvas.print_png(response)
    return response
2个回答

60

如果你想要将图片放在实际图形的角落(而不是坐标轴的角落),可以查看 figimage

也许像这样?(使用PIL读取图像):

import matplotlib.pyplot as plt
import Image
import numpy as np

im = Image.open('/home/jofer/logo.png')
height = im.size[1]

# We need a float array between 0-1, rather than
# a uint8 array between 0-255
im = np.array(im).astype(np.float) / 255

fig = plt.figure()

plt.plot(np.arange(10), 4 * np.arange(10))

# With newer (1.0) versions of matplotlib, you can 
# use the "zorder" kwarg to make the image overlay
# the plot, rather than hide behind it... (e.g. zorder=10)
fig.figimage(im, 0, fig.bbox.ymax - height)

# (Saving with the same dpi as the screen default to
#  avoid displacing the logo image)
fig.savefig('/home/jofer/temp.png', dpi=80)

plt.show()

如果你想让图像成为固定比例的图形宽度/高度,另一种选择是创建一个“虚拟”坐标轴,并使用imshow将图像放置在其中。这样,图像的大小和位置与DPI和图形的绝对大小无关:

alt text

import matplotlib.pyplot as plt
from matplotlib.cbook import get_sample_data

im = plt.imread(get_sample_data('grace_hopper.jpg'))

fig, ax = plt.subplots()
ax.plot(range(10))

# Place the image in the upper-right corner of the figure
#--------------------------------------------------------
# We're specifying the position and size in _figure_ coordinates, so the image
# will shrink/grow as the figure is resized. Remove "zorder=-1" to place the
# image in front of the axes.
newax = fig.add_axes([0.8, 0.8, 0.2, 0.2], anchor='NE', zorder=-1)
newax.imshow(im)
newax.axis('off')

plt.show()

在这里输入图片描述


有没有一种方法可以实现独立于 DPI 的图像放置? - tillsten
1
@tillsten - 有几种不同的方法,但它们都是hackish的。你想要dpi独立的是图像的大小、位置还是两者兼而有之?如果两者都是,一个方便的技巧是创建一个新的轴(手动指定其位置和大小),使用
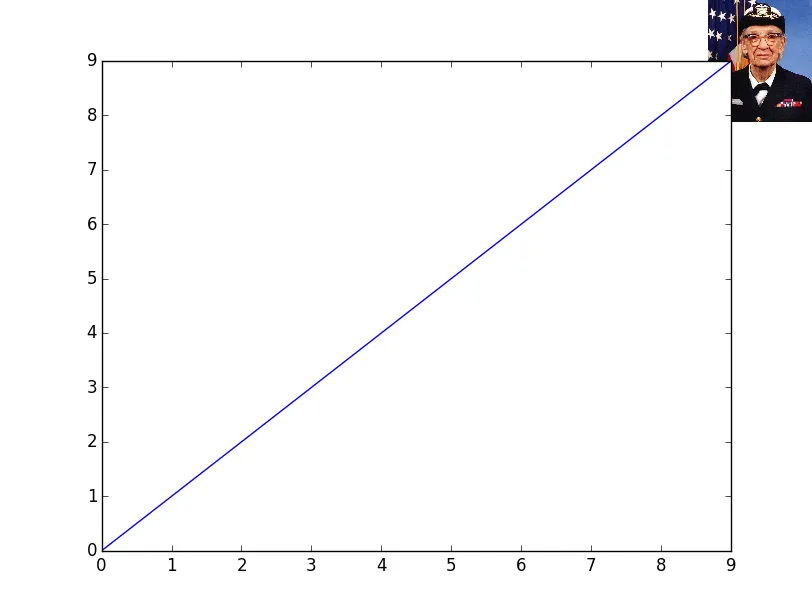
imshow,并使用axis('off')关闭刻度等。各种OffsetImage功能是另一种方法,但如果您选择这条路线,大小就不是dpi独立的。 - Joe Kington
1
@tillsten - 其实,现在我想起来了,如果你只想以独立于dpi的方式将图像放置在另一个角落,有一个更简单的方法。我会用一个例子更新答案。 - Joe Kington
两者对于我的计划使用可能都是最好的选择,也许BboxImage是更好的选择,但我找不到如何使用它的文档,所以我尝试使用OffsetImage进行操作,但它有一个缺点,就是会根据dpi而偏移。源代码中甚至有一个fixme。 - tillsten
好的,我至少已经让固定位置正常工作了,使用OffsetImage和AnnotationBox。但是当保存为PDF时,由于内部使用72 dpi,大小会发生变化。 - tillsten
显示剩余5条评论

8
现在有一种更简单的方法,使用新的 inset_axes 命令(需要 matplotlib >3.0)。
该命令允许将一个新的坐标轴定义为现有 axes 对象的子级。这样做的好处是,您可以使用适当的 transform 表达式,以任何您喜欢的单位来定义插图坐标轴,如坐标轴分数或数据坐标。
以下是一个代码示例:
# Imports
import matplotlib.pyplot as plt
import matplotlib as mpl

# read image file
with mpl.cbook.get_sample_data(r"C:\path\to\file\image.png") as file:
arr_image = plt.imread(file, format='png')

# Draw image
axin = ax.inset_axes([105,-145,40,40],transform=ax.transData)    # create new inset axes in data coordinates
axin.imshow(arr_image)
axin.axis('off')

这种方法的优点是,随着坐标轴的重新缩放,您的图像会自动缩放!

网页内容由stack overflow 提供, 点击上面的
可以查看英文原文,
原文链接