add_subplot() 方法有几种调用方式:
add_subplot(nrows, ncols, index, **kwargs)add_subplot(pos, **kwargs)add_subplot(ax)add_subplot() <-- 自3.1.0版本以来
第一次和第二次调用:
第一次和第二次调用实现了相同的功能(在下面解释的限制范围内)。可以将它们看作首先使用前两个数字指定网格布局(2x2、1x8、3x4等),例如:
f.add_subplot(3,4,1)
f.add_subplot(341)
两种方式都生成一个(3 x 4 = 12)个子图呈3行4列的子图安排。每个调用中的第{{3}}个数字表示返回哪个坐标轴对象,从左上角开始从{{1}}递增到右侧。
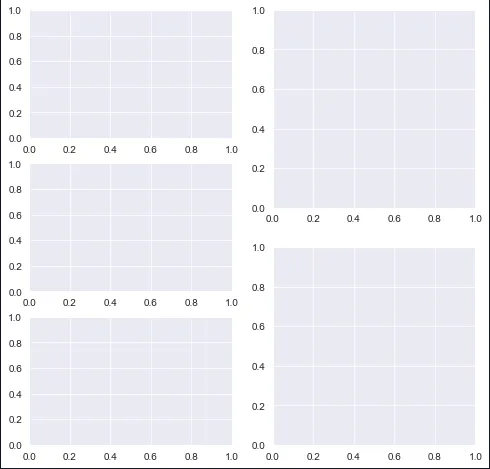
此代码说明了使用调用{{2}}的限制。
import matplotlib.pyplot as plt
def plot_and_text(axis, text):
'''Simple function to add a straight line
and text to an axis object'''
axis.plot([0,1],[0,1])
axis.text(0.02, 0.9, text)
f = plt.figure()
f2 = plt.figure()
_max = 12
for i in range(_max):
axis = f.add_subplot(3,4,i+1, fc=(0,0,0,i/(_max*2)), xticks=[], yticks=[])
plot_and_text(axis,chr(i+97) + ') ' + '3,4,' +str(i+1))
if i < 9:
axis = f2.add_subplot(341+i, fc=(0,0,0,i/(_max*2)), xticks=[], yticks=[])
plot_and_text(axis,chr(i+97) + ') ' + str(341+i))
f.tight_layout()
f2.tight_layout()
plt.show()
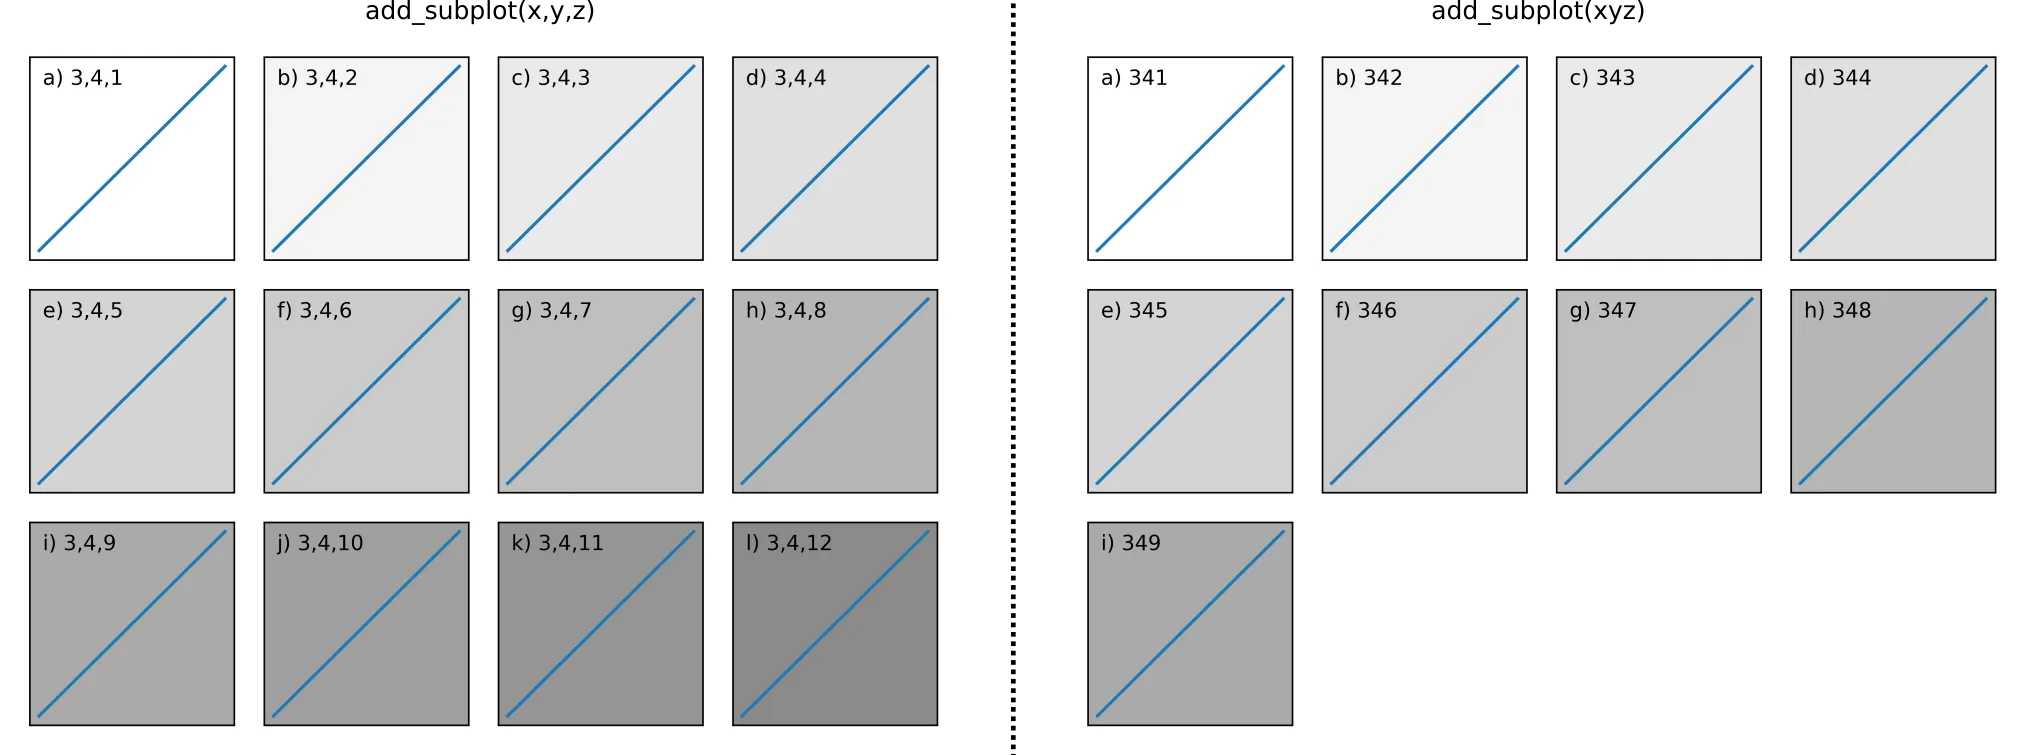
通过在左侧使用调用 1,您可以返回任何轴对象;然而,在右侧使用调用 2时,您只能返回索引最多为9的轴对象,这使得子图j),k)和l)无法使用此调用访问。
即它阐明了这一点来自文档:
pos是一个三位数的整数,其中第一位是行数,第二位是列数,第三位是子图的索引。例如,fig.add_subplot(235)与fig.add_subplot(2, 3, 5)相同。 请注意,所有整数都必须小于10才能使用此形式。
调用 3
在极少数情况下, add_subplot 可以被调用只传入一个参数,此时该参数应为一个子图axes实例,该实例已经在当前图形中创建,但未出现在图形的axes列表中。
调用 4(自 3.1.0 起):
如果没有传递位置参数,则默认为(1,1,1)。
也就是说,重现问题中的调用 fig.add_subplot(111)。这基本上设置了一个1×1的子图网格,并返回网格中第一个(也是唯一的)轴对象。
1.5.0版本中不支持),这似乎只适用于Matlab。(请注意,在Matplotlib中还有其他选项可以实现此行为,例如gridspec) - lab