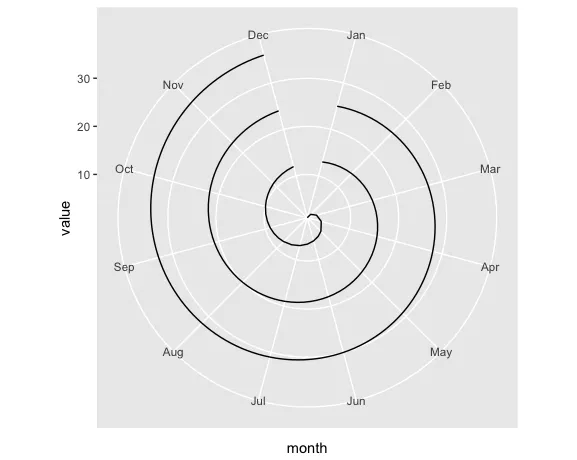
当ggplot使用极坐标制作线图时,它会在最高和最低x值之间留下一个缺口(如下面的
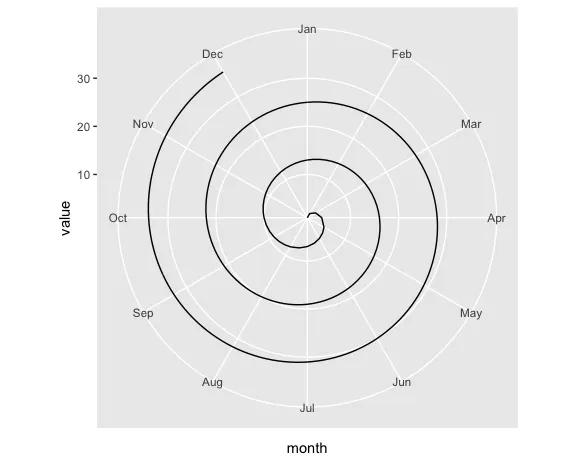
特别地,我想将月份用作x轴,但在一个循环线中绘制多年的数据。
Reprex:
Dec和Jan),而不是绕成螺旋形。我该如何继续画这条线并关闭这个间隙?特别地,我想将月份用作x轴,但在一个循环线中绘制多年的数据。
Reprex:
library(ggplot2)

# three years of monthly data
df <- expand.grid(month = month.abb, year = 2014:2016)
df$value <- seq_along(df$year)

head(df)
##   month year value
## 1   Jan 2014     1
## 2   Feb 2014     2
## 3   Mar 2014     3
## 4   Apr 2014     4
## 5   May 2014     5
## 6   Jun 2014     6

ggplot(df, aes(month, value, group = year)) +
    geom_line() +
    coord_polar()