首先,由于没有提供示例数据,我自己制作了示例数据。这些数据已经被汇总了(每个级别组合只有一个值)。
set.seed(1)
df<-data.frame(expand.grid(c("Control","Effect"),c("Self","Other"),c("Type1","Type2")),
     runif(8,0,1))
colnames(df)<-c("Treatment","Group","Type","value")
df
  Treatment Group  Type     value
1   Control  Self Type1 0.2655087
2    Effect  Self Type1 0.3721239
3   Control Other Type1 0.5728534
4    Effect Other Type1 0.9082078
5   Control  Self Type2 0.2016819
6    Effect  Self Type2 0.8983897
7   Control Other Type2 0.9446753
8    Effect Other Type2 0.6607978
现在你需要添加两个新值来表示线的位置。
ymin 值为原始值加上一个小常数。
ymax 值根据每个分面(使用
Treatment 和
Type 作为分组)计算,并且它是该分面中最大值再加上一些常数。
library(plyr)
df<-ddply(df,.(Treatment,Type),transform,ymax=max(value)+0.2)
df$ymin<-df$value+0.05
df
  Treatment Group  Type     value      ymax      ymin
1   Control  Self Type1 0.2655087 0.7728534 0.3155087
2   Control  Self Type2 0.2016819 1.1446753 0.2516819
3   Control Other Type1 0.5728534 0.7728534 0.6228534
4   Control Other Type2 0.9446753 1.1446753 0.9946753
5    Effect  Self Type1 0.3721239 1.1082078 0.4221239
6    Effect  Self Type2 0.8983897 1.0983897 0.9483897
7    Effect Other Type1 0.9082078 1.1082078 0.9582078
8    Effect Other Type2 0.6607978 1.0983897 0.7107978
第二个数据框是用于标签的。在每个小面板中,y轴位置再次为原始的
ymax 值加上一些常量,而
lab 包含需要显示的标签。
df.names<-ddply(df,.(Treatment,Type),summarise,ymax=ymax[1]+0.1)
df.names$lab<-c("p=0.46","**","***","*")
df.names
  Treatment  Type      ymax    lab
1   Control Type1 0.8728534 p=0.46
2   Control Type2 1.2446753     **
3    Effect Type1 1.2082078    ***
4    Effect Type2 1.1983897      *
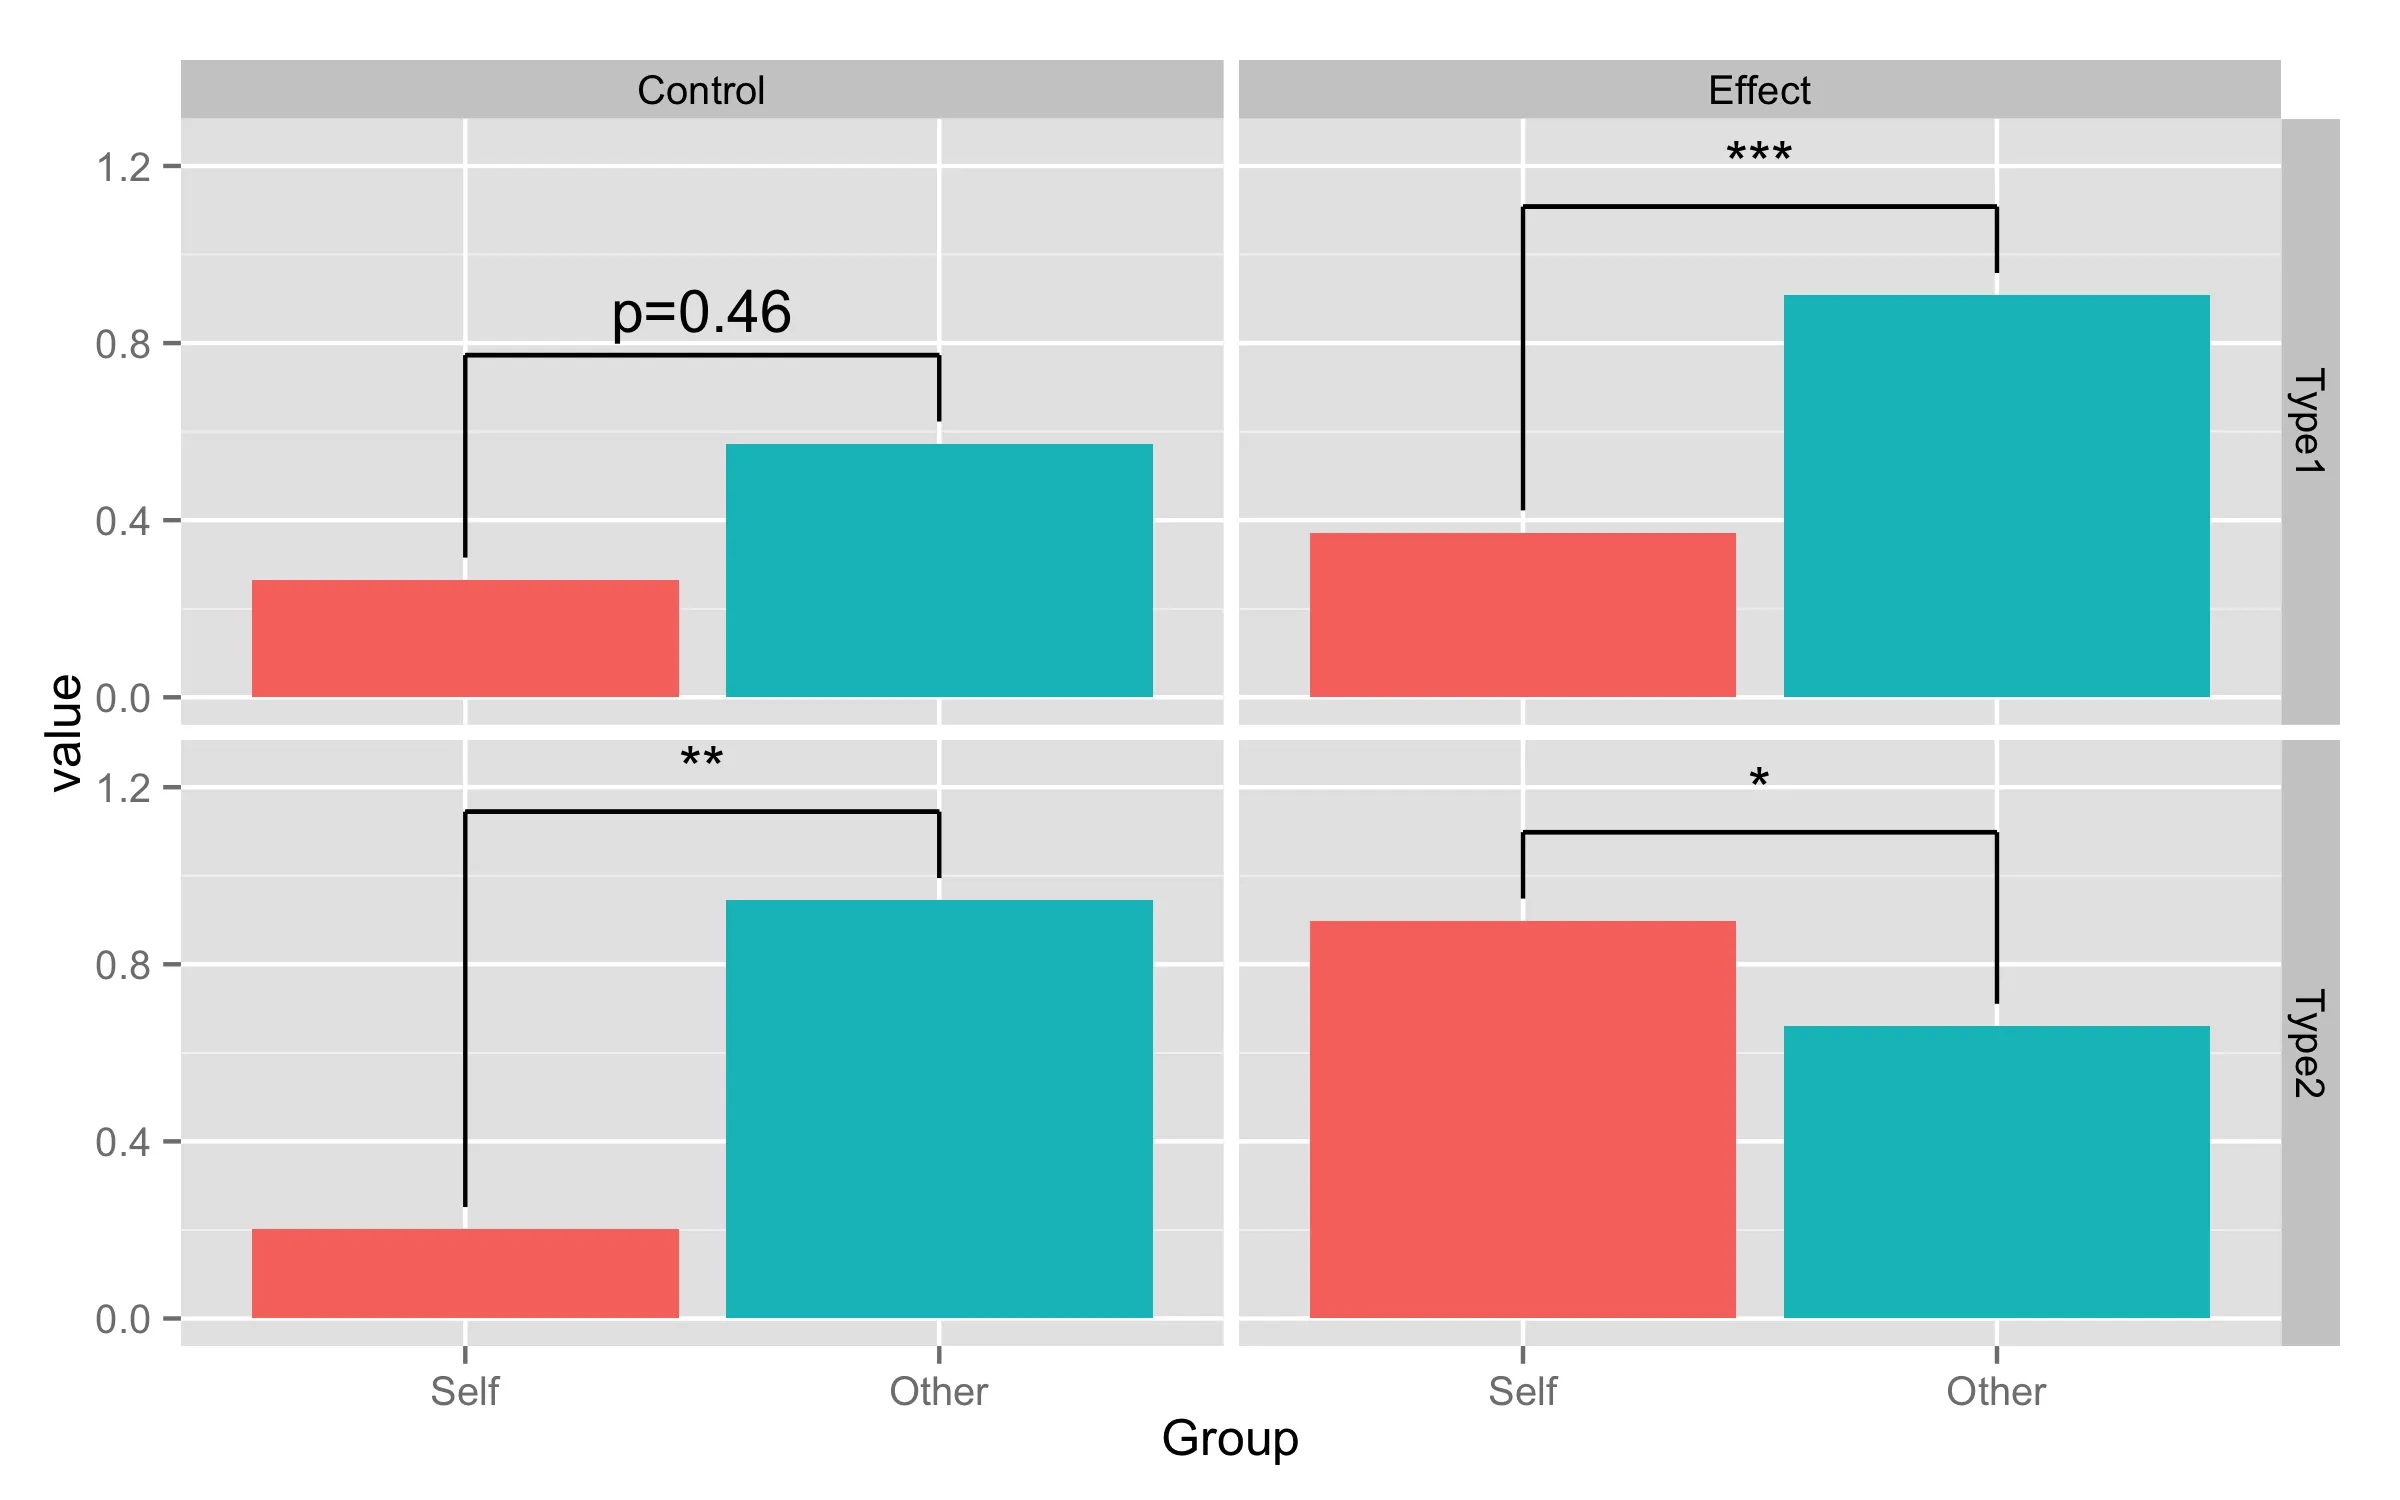
现在已经使用了总结值df,因此请使用geom_bar(stat="identity")代替stat_summary()。两个geom_segment()调用添加了额外的线条-第一个绘制垂直线条,第二个添加水平线条。 geom_text()在线条上方添加标签。
ggplot(df, aes(Group,value,fill=Group)) +
  geom_bar(stat="identity") + facet_grid(Type~Treatment) +
  theme(legend.position="none")+
  geom_segment(aes(x=Group,xend=Group,y=ymin,yend=ymax))+
  geom_segment(aes(x="Self",xend="Other",y=ymax,yend=ymax))+
  geom_text(data=df.names,aes(x=1.5,y=ymax,label=lab),inherit.aes=FALSE)