使用facet_wrap的ggplot箱线图中没有异常值。

24

我希望使用ggplot绘制无异常值的箱线图,只关注箱体和须部分。

例如:

p1 <- ggplot(diamonds, aes(x=cut, y=price, fill=cut))
p1 + geom_boxplot() + facet_wrap(~clarity, scales="free")

提供具有离群值的分面箱线图

enter image description here

我可以使用outlier.size = NA来抑制离群点:

p1 <- ggplot(diamonds, aes(x=cut, y=price, fill=cut))
p1 + geom_boxplot(outlier.size=NA) + facet_wrap(~clarity, scales="free")

提供的内容

enter image description here

在这里,y轴刻度与原始图表相同,只是异常值不会显示。 如何现在根据盒须端点修改比例尺以“放大”每个面板?

我可以这样重置ylim

ylim1 = boxplot.stats(diamonds$price)$stats[c(1, 5)]

然后重新绘制

p1 + geom_boxplot(outlier.size=NA) 
   + facet_wrap(~clarity, scales="free") 
   +  coord_cartesian(ylim = ylim1*1.05)

但是这种方法在“facets”上不起作用:

enter image description here

有没有一种方法可以“facet_wrap”箱线图统计函数?

编辑:

我已经尝试动态计算箱线图统计数据,但似乎不起作用。

give.stats <- function(x){return(boxplot.stats(x)$stats[c(1,5)])}

p1 + geom_boxplot(outlier.size=NA) + 
  facet_wrap(~clarity, scales="free") + 
  coord_cartesian(ylim = give.stats)

> Error in min(x, na.rm = na.rm) : invalid 'type' (list) of argument

如果您有更多的想法,我们将不胜感激。

4个回答

19

这可以使用stat_summary和自定义统计计算函数完成:

calc_boxplot_stat <- function(x) {
  coef <- 1.5
  n <- sum(!is.na(x))
  # calculate quantiles
  stats <- quantile(x, probs = c(0.0, 0.25, 0.5, 0.75, 1.0))
  names(stats) <- c("ymin", "lower", "middle", "upper", "ymax")
  iqr <- diff(stats[c(2, 4)])
  # set whiskers
  outliers <- x < (stats[2] - coef * iqr) | x > (stats[4] + coef * iqr)
  if (any(outliers)) {
    stats[c(1, 5)] <- range(c(stats[2:4], x[!outliers]), na.rm = TRUE)
  }
  return(stats)
}

ggplot(diamonds, aes(x=cut, y=price, fill=cut)) + 
    stat_summary(fun.data = calc_boxplot_stat, geom="boxplot") + 
    facet_wrap(~clarity, scales="free")

output figure

统计计算函数是通用的,因此在绘图之前不需要进行数据操作。

还可以将whiskers设置为10%和90%:

calc_stat <- function(x) {
  coef <- 1.5
  n <- sum(!is.na(x))
  # calculate quantiles
  stats <- quantile(x, probs = c(0.1, 0.25, 0.5, 0.75, 0.9))
  names(stats) <- c("ymin", "lower", "middle", "upper", "ymax")
  return(stats)
}

ggplot(diamonds, aes(x=cut, y=price, fill=cut)) + 
    stat_summary(fun.data = calc_stat, geom="boxplot") + 
    facet_wrap(~clarity, scales="free")

显示10%和90%分位数的图表


7

通过outlier.size=NA,你可以使异常值消失,但这并不是忽略异常值绘制箱线图的选项。因此,绘图时考虑了(不可见的)异常值。似乎没有符合你要求的选项。为了按照你的需求绘制箱线图,我会自己计算分位数,并基于这些分位数生成箱线图,就像以下示例一样:

stat<-tapply(diamonds$price,list(diamonds$cut,diamonds$clarity),function(x) boxplot.stats(x))
stats<-unlist(tapply(diamonds$price,list(diamonds$cut,diamonds$clarity),function(x) boxplot.stats(x)$stats))

df<-data.frame(
  cut=rep(rep(unlist(dimnames(stat)[1]),each=5),length(unlist(dimnames(stat)[2]))),
  clarity=rep(unlist(dimnames(stat)[2]),each=25),
  price=unlist(tapply(diamonds$price,list(diamonds$cut,diamonds$clarity),function(x) boxplot.stats(x)$stats)))

ggplot(df,aes(x=cut,y=price,fill=cut))+geom_boxplot()+facet_wrap(~clarity,scales="free")

这给出了不同的顺序(请注意图中的顺序已经改变):

enter image description here


你可以考虑设置因子水平的顺序,使其与原始数据匹配 (df$cut = factor(df$cut, levels = levels(diamonds$cut)))。 - aosmith
谢谢,那可能是一个解决方法。然而,我仍然在想是否真的没有更优美的解决方案。我一直在尝试在绘图函数中编写一个计算箱线图统计数据的函数(参见上面的编辑),但没有成功... - user3460194

5

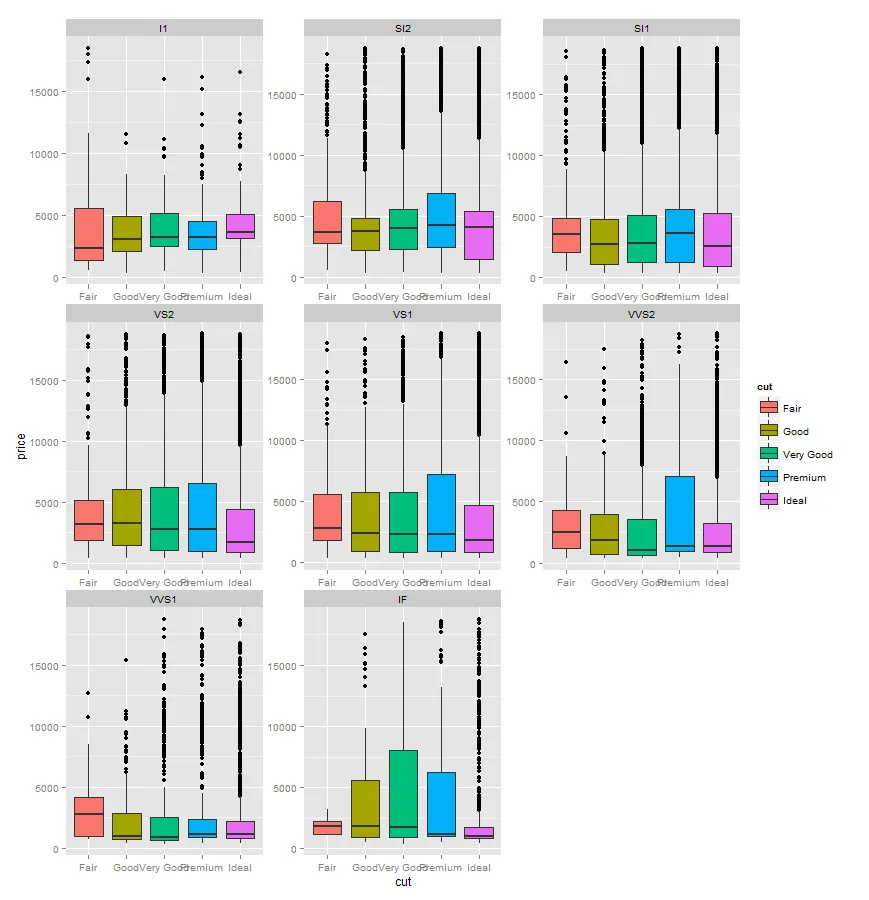
好的,我找到了一个更简单的方法,通过注释原始ggplot盒图函数中的一些行并调用修改后的函数来完成。

我不是程序员,不知道这是否是一个好的或者健壮的做法,但目前看起来还可以。

以下是我正在使用的修改后的函数:

#modified version of geom_boxplot

require(ggplot2)
geom_boxplot_noOutliers <- function (mapping = NULL, data = NULL, stat = "boxplot",
                          position = "dodge", outlier.colour = NULL,
                          outlier.shape = NULL, outlier.size = NULL,
                          notch = FALSE, notchwidth = .5, varwidth = FALSE,
                          ...) {

  #outlier_defaults <- ggplot2:::Geom$find('point')$default_aes()

  #outlier.colour   <- outlier.colour %||% outlier_defaults$colour
  #outlier.shape    <- outlier.shape  %||% outlier_defaults$shape
  #outlier.size     <- outlier.size   %||% outlier_defaults$size

  GeomBoxplot_noOutliers$new(mapping = mapping, data = data, stat = stat,
                  position = position, outlier.colour = outlier.colour,
                  outlier.shape = outlier.shape, outlier.size = outlier.size, notch = notch,
                  notchwidth = notchwidth, varwidth = varwidth, ...)
}

GeomBoxplot_noOutliers <- proto(ggplot2:::Geom, {
  objname <- "boxplot_noOutliers"

  reparameterise <- function(., df, params) {
    df$width <- df$width %||%
      params$width %||% (resolution(df$x, FALSE) * 0.9)

  # if (!is.null(df$outliers)) {
  #    suppressWarnings({
  #      out_min <- vapply(df$outliers, min, numeric(1))
  #      out_max <- vapply(df$outliers, max, numeric(1))
  #    })
  #    
  #    df$ymin_final <- pmin(out_min, df$ymin)
  #    df$ymax_final <- pmax(out_max, df$ymax)
  #   }

    # if `varwidth` not requested or not available, don't use it
    if (is.null(params) || is.null(params$varwidth) || !params$varwidth || is.null(df$relvarwidth)) {
      df$xmin <- df$x - df$width / 2
      df$xmax <- df$x + df$width / 2
    } else {
      # make `relvarwidth` relative to the size of the largest group
      df$relvarwidth <- df$relvarwidth / max(df$relvarwidth)
      df$xmin <- df$x - df$relvarwidth * df$width / 2
      df$xmax <- df$x + df$relvarwidth * df$width / 2
    }
    df$width <- NULL
    if (!is.null(df$relvarwidth)) df$relvarwidth <- NULL

    df
  }

  draw <- function(., data, ..., fatten = 2, outlier.colour = NULL, outlier.shape = NULL, outlier.size = 2,
                   notch = FALSE, notchwidth = .5, varwidth = FALSE) {
    common <- data.frame(
      colour = data$colour,
      size = data$size,
      linetype = data$linetype,
      fill = alpha(data$fill, data$alpha),
      group = data$group,
      stringsAsFactors = FALSE
    )

    whiskers <- data.frame(
      x = data$x,
      xend = data$x,
      y = c(data$upper, data$lower),
      yend = c(data$ymax, data$ymin),
      alpha = NA,
      common)

    box <- data.frame(
      xmin = data$xmin,
      xmax = data$xmax,
      ymin = data$lower,
      y = data$middle,
      ymax = data$upper,
      ynotchlower = ifelse(notch, data$notchlower, NA),
      ynotchupper = ifelse(notch, data$notchupper, NA),
      notchwidth = notchwidth,
      alpha = data$alpha,
      common)

  #  if (!is.null(data$outliers) && length(data$outliers[[1]] >= 1)) {
  #    outliers <- data.frame(
  #      y = data$outliers[[1]],
  #      x = data$x[1],
  #      colour = outlier.colour %||% data$colour[1],
  #      shape = outlier.shape %||% data$shape[1],
  #      size = outlier.size %||% data$size[1],
  #      fill = NA,
  #      alpha = NA,
  #      stringsAsFactors = FALSE)
  #    outliers_grob <- GeomPoint$draw(outliers, ...)
  #  } else {
      outliers_grob <- NULL
  #  }

    ggname(.$my_name(), grobTree(
      outliers_grob,
      GeomSegment$draw(whiskers, ...),
      GeomCrossbar$draw(box, fatten = fatten, ...)
    ))
  }

  guide_geom <- function(.) "boxplot_noOutliers"
  draw_legend <- function(., data, ...)  {
    data <- aesdefaults(data, .$default_aes(), list(...))
    gp <- with(data, gpar(col=colour, fill=alpha(fill, alpha), lwd=size * .pt, lty = linetype))
    gTree(gp = gp, children = gList(
      linesGrob(0.5, c(0.1, 0.25)),
      linesGrob(0.5, c(0.75, 0.9)),
      rectGrob(height=0.5, width=0.75),
      linesGrob(c(0.125, 0.875), 0.5)
    ))
  }

  default_stat <- function(.) StatBoxplot
  default_pos <- function(.) PositionDodge
  default_aes <- function(.) aes(weight=1, colour="grey20", fill="white", size=0.5, alpha = NA, shape = 16, linetype = "solid")
  required_aes <- c("x", "lower", "upper", "middle", "ymin", "ymax")

})

我将它保存为一个r文件,并使用source加载它:

library(ggplot2)
library(scales)

#load functions
source("D:/Eigene Dateien/Scripte/R-Scripte/myfunctions/geomBoxplot_noOutliers.r")

现在我可以使用
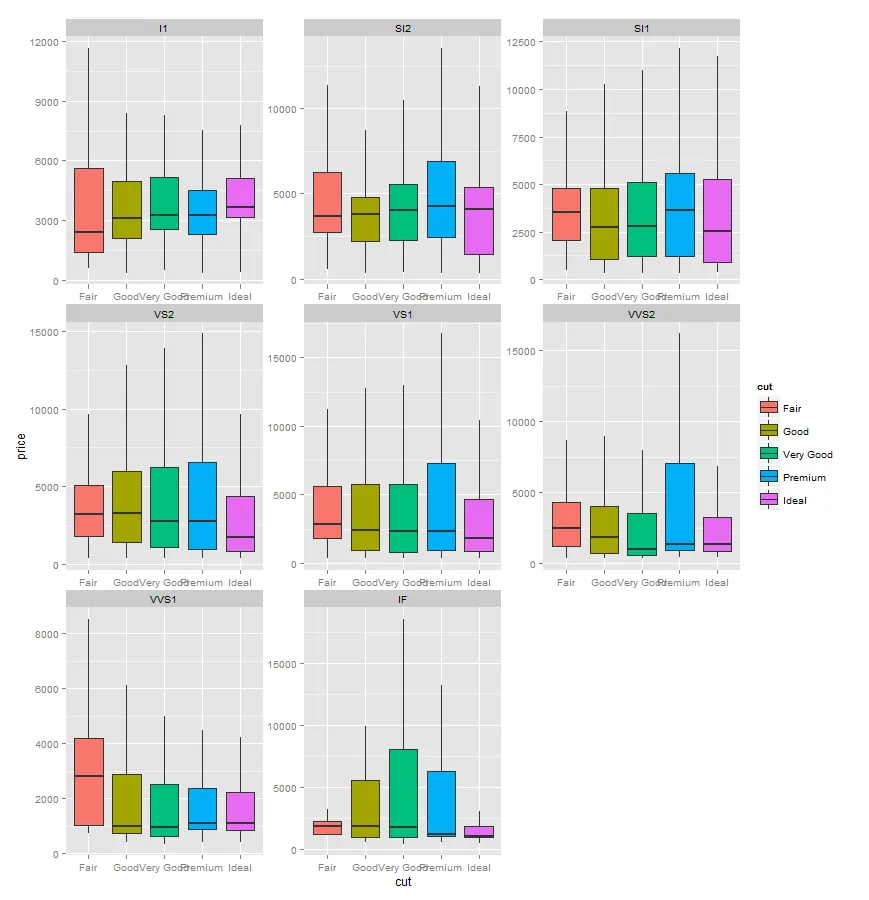
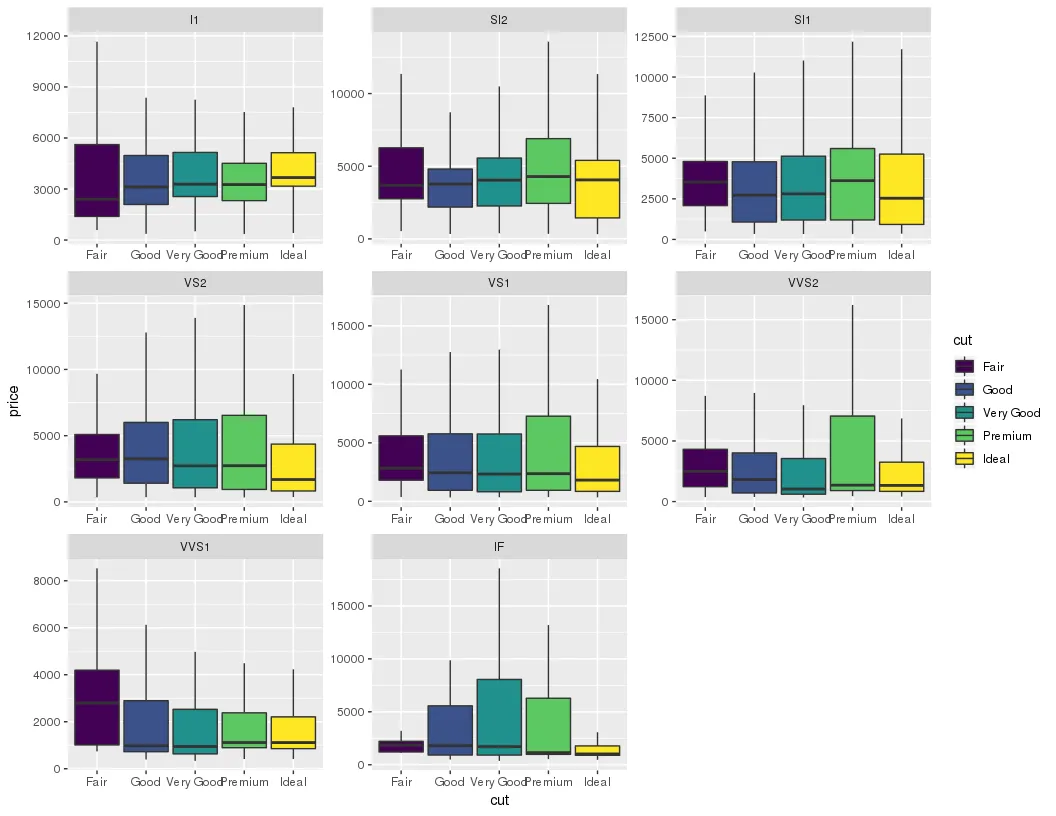
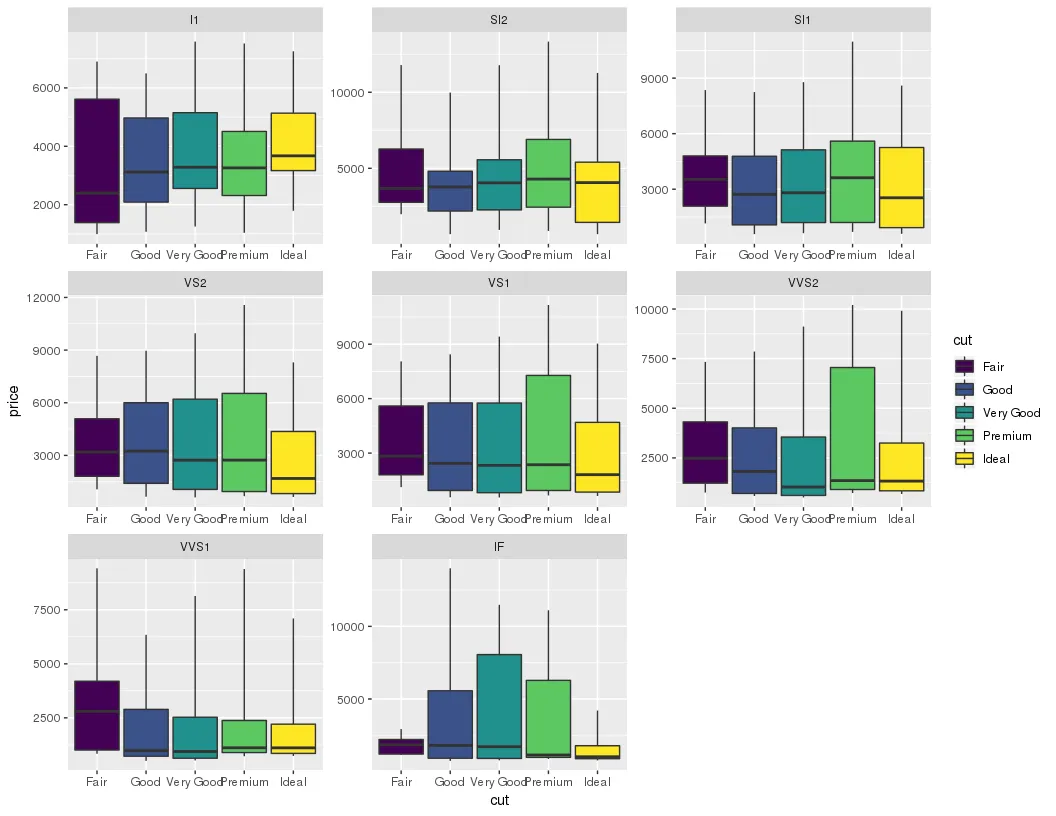
geom_boxplot_noOutliers绘制没有异常值的图形,即使有多个面板也可以正常工作 :-)
p1 <- ggplot(diamonds, aes(x=cut, y=price, fill=cut))
p1 + geom_boxplot_noOutliers() + facet_wrap(~clarity, scales="free")

enter image description here


这是个好主意!但不幸的是,答案已经过时了。 - moodymudskipper

-3
在您的情况下,我想限制显示范围可能会起作用,因为所有的异常值都大于10000。
p1 + geom_boxplot() + ylim(0,10000)

不,它不起作用(有一个可重现的示例,您可以检查)。ylim 不限制显示范围,它会删除数据点,之后会分配“新的异常值”。 - pogibas

网页内容由stack overflow 提供, 点击上面的
可以查看英文原文,
原文链接