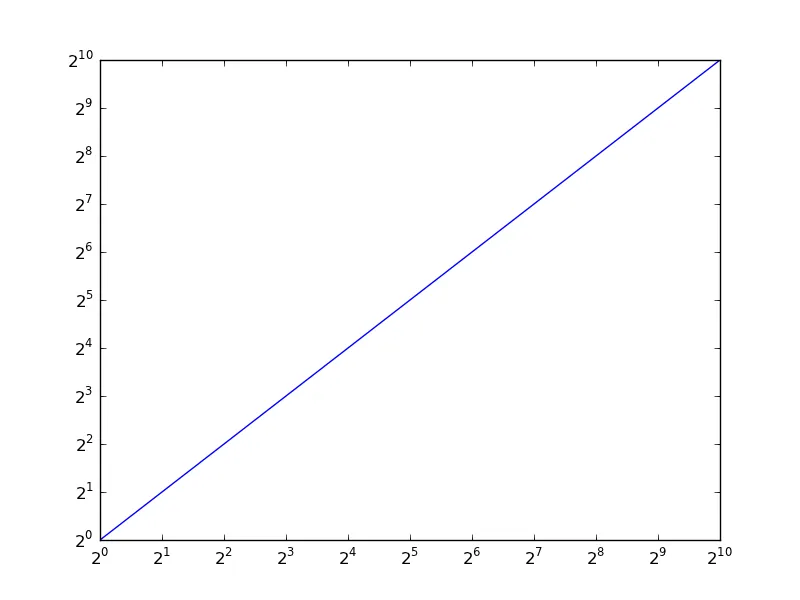
Matplotlib >= 3.3:
指定 base=2:
import matplotlib.pyplot as plt

fig, ax = plt.subplots()
ax.set_xscale('log', base=2)
ax.set_yscale('log', base=2)

ax.plot(range(1024))
plt.show()
Matplotlib < 3.3:
为x轴和y轴指定
basex=2和/或
basey=2。
import matplotlib.pyplot as plt

fig, ax = plt.subplots()
ax.set_xscale('log', basex=2)
ax.set_yscale('log', basey=2)

ax.plot(range(1024))
plt.show()
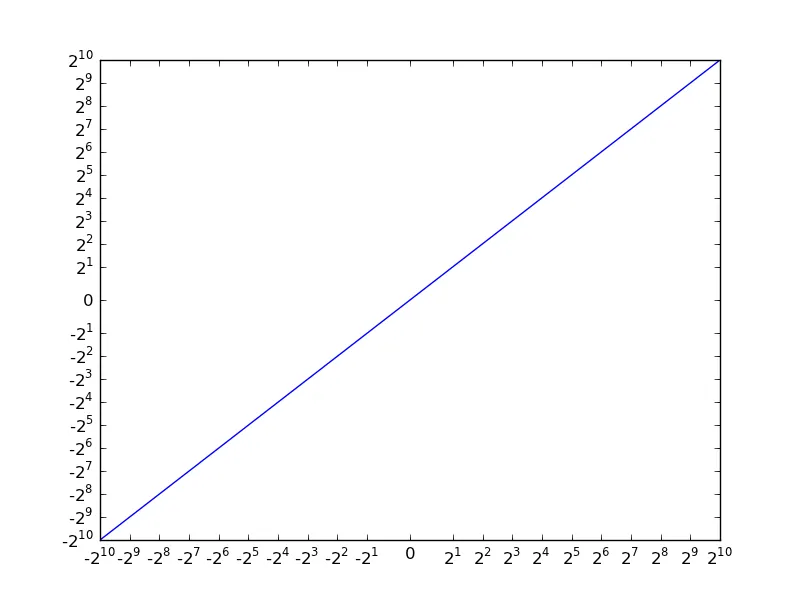
对于零交叉行为,你所指的是“对称对数”图(也称为“symlog”)。不管怎么说,数据并没有被过滤掉,只是在接近0的地方是线性图,在其他地方是对数图。改变的是刻度,而不是数据。
通常你只需要使用
ax.set_xscale('symlog', basex=2),但是目前在symlog图中使用非10为底的对数似乎有些问题。
编辑:
哈!这个bug似乎是由一个经典错误引起的:使用可变的默认参数。
我已经提交了一个bug报告,但是如果你想修复它,你需要在
lib/matplotlib/ticker.py文件中的大约1376行附近,在
SymmetricalLogLocator类的
__init__方法中进行一个小的编辑。
而不是
def __init__(self, transform, subs=[1.0]):
    self._transform = transform
    self._subs = subs
    ...
改成类似的东西:
def __init__(self, transform, subs=None):
    self._transform = transform
    if subs is None:
        self._subs = [1.0]
    else:
        self._subs = subs
    ....
经过这个改变,它的表现符合预期...
import matplotlib.pyplot as plt
import numpy as np

fig, ax = plt.subplots()
ax.set_xscale('symlog', basex=2)
ax.set_yscale('symlog', basey=2)

x = np.arange(-1024, 1024)
ax.plot(x, x)

plt.show()