Matplotlib数学文本:刻度标签中的字形错误

11
我注意到在使用默认的mathtext而不是LaTeX数学渲染引擎时,matplotlib 2.0.2中呈现数学公式时存在错误。似乎 mathtext 无法识别某些字形(在我的情况下是减号和乘号)。更奇怪的是,只有当这些特定的字形出现在刻度标签中时才会出现错误。当我故意在图标题中输入一些数学表达式时,它就能正常工作。

请考虑以下示例及其结果图像:

import matplotlib
import matplotlib.pyplot as plt

# Customize matplotlib
matplotlib.rcParams.update({# Use mathtext, not LaTeX
                            'text.usetex': False,
                            # Use the Computer modern font
                            'font.family': 'serif',
                            'font.serif': 'cmr10',
                            'mathtext.fontset': 'cm',
                            })

# Plot
plt.semilogy([-0.03, 0.05], [0.3, 0.05])
plt.title(r'$-6\times 10^{-2}$')
plt.savefig('test.png')

test.png

正如图片所示,刻度标签中的乘法和一些减号已被替换为其他字符。如果我使用LaTeX(通过将
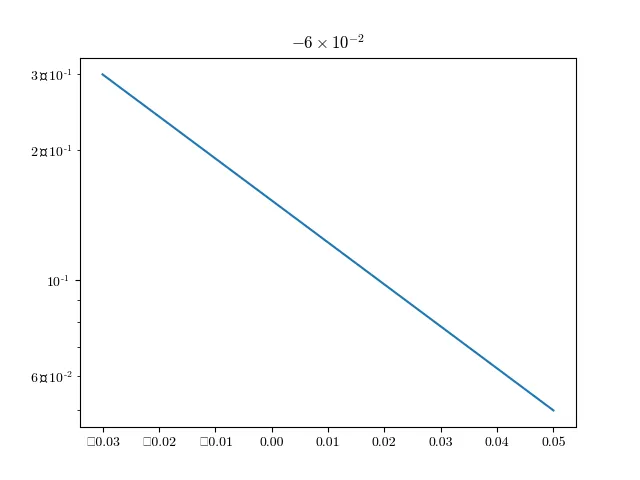
'text.usetex'设置为True),则一切都可以很好地呈现。为什么会发生这种情况,更重要的是,我如何在不从mathtext转换为LaTeX的情况下解决它?

附加信息

这是运行示例代码时打印的警告:

mathtext.py:866: MathTextWarning: Font 'default' does not have a glyph for '\times' [U+d7]
  MathTextWarning)
mathtext.py:867: MathTextWarning: Substituting with a dummy symbol.
  warn("Substituting with a dummy symbol.", MathTextWarning)

请注意,指数中出现的减号会正确地呈现。如果我省略'mathtext.fontset': 'cm',这些符号也不会正确呈现,会产生另一个类似的警告:
mathtext.py:866: MathTextWarning: Font 'default' does not have a glyph for '-' [U+2212]
  MathTextWarning)
mathtext.py:867: MathTextWarning: Substituting with a dummy symbol.
  warn("Substituting with a dummy symbol.", MathTextWarning)

此��,如果我在rcParams中包含'axes.unicode_minus': False(并保留'mathtext.fontset': 'cm'),则所有减号都会正确呈现,但乘法符号的问题仍然存在。
在旧版本的matplotlib上(我已经测试了1.5.1、1.4.3和1.3.1),乘法符号错误似乎不是问题。然而,这些matplotib坚持只在10⁻²、10⁻¹、1、10、10²等处产生刻度标签,因此永远不需要乘法符号。
故障报告
这已被提交为Matplotlib的bug report

这似乎是“cmr10”字体的问题。如果您使用
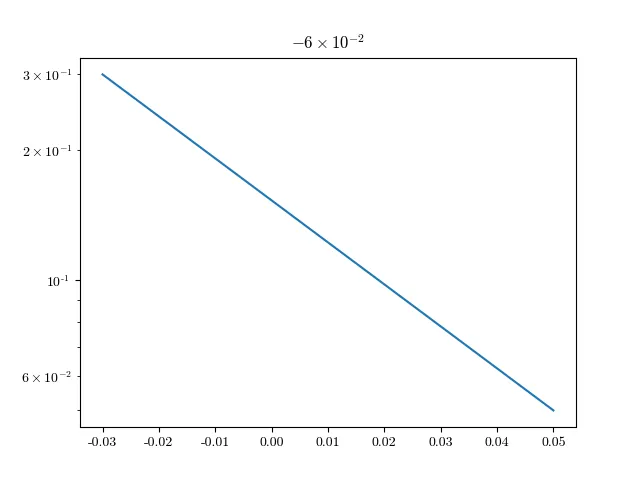
'font.serif': 'Times New Roman',则可以正常显示。如果您认为“cmr10”也应该起作用,那么将其发布到matplotlib问题跟踪器上可能是个好主意。 - ImportanceOfBeingErnest
@ImportanceOfBeingErnest 是的,更改为其他字体有所帮助。但是,我非常希望使用与matplotlib一起提供的“计算机现代”类似的字体。我还没有找到可确保在所有matplotlib安装中都可用的完整字体列表。 - jmd_dk
如果字体在标题中呈现正确,但在轴标签中却没有呈现正确,那么我想这可能被视为一个错误。因此,在应该报告的地方报告它仍然是最好的主意,我认为。 - ImportanceOfBeingErnest
3个回答

10

我认为STIX字体是计算机现代字体的可接受替代品。

import matplotlib
import matplotlib.pyplot as plt

# Customize matplotlib
matplotlib.rcParams.update(
    {
        'text.usetex': False,
        'font.family': 'stixgeneral',
        'mathtext.fontset': 'stix',
    }
)

# Plot
plt.semilogy([-0.03, 0.05], [0.3, 0.05])
plt.title(r'$-6\times 10^{-2}$')
plt.savefig('test.png')

在我的笔记本电脑上,这将产生以下输出:

enter image description here


我已经通过Anaconda 3复现了相同的问题。 - caot

3

问题原因

现在我明白了发生了什么。yticklabels的格式都类似于

r'$\mathdefault{6\times10^{-2}}$'

这对于主刻度标签来说很好用,因为\times10^{-2}部分不存在。我认为这对于次刻度标签失败了,因为\times\mathdefault{}内无法使用。正如此处所述,\mathdefault{}用于产生与mathtext使用相同字体的常规(非数学)文本,但可用符号要少得多。由于\mathdefault{}内的所有内容都是数学内容,因此使用\mathdefault{}是完全多余的,因此可以安全地删除它。这解决了问题。

解决方案

一个解决方法是使用matplotlib的刻度格式化程序。然而,我想保持默认(次要)刻度标签位置和(预期的)格式,因此更简单的解决方法是将刻度标签中的\mathdefault部分删除。
import warnings
import matplotlib
import matplotlib.pyplot as plt
from matplotlib.mathtext import MathTextWarning

# Customize matplotlib
matplotlib.rcParams.update({# Use mathtext, not LaTeX
                            'text.usetex': False,
                            # Use the Computer modern font
                            'font.family': 'serif',
                            'font.serif': 'cmr10',
                            'mathtext.fontset': 'cm',
                            # Use ASCII minus
                            'axes.unicode_minus': False,
                            })
# Function implementing the fix
def fix(ax=None):
    if ax is None:
        ax = plt.gca()
    fig = ax.get_figure()
    # Force the figure to be drawn
    with warnings.catch_warnings():
        warnings.simplefilter('ignore', category=MathTextWarning)
        fig.canvas.draw()
    # Remove '\mathdefault' from all minor tick labels
    labels = [label.get_text().replace('\mathdefault', '')
              for label in ax.get_xminorticklabels()]
    ax.set_xticklabels(labels, minor=True)
    labels = [label.get_text().replace('\mathdefault', '')
              for label in ax.get_yminorticklabels()]
    ax.set_yticklabels(labels, minor=True)
# Plot
plt.semilogy([-0.03, 0.05], [0.3, 0.05])
plt.title(r'$-6\times 10^{-2}$')
fix()
plt.savefig('test.png')

写这个修复程序的棘手之处在于,你无法在绘制完图形之前获取刻度标签。因此,我们需要首先调用 fig.canvas.draw()。这将引发警告,我已经将其抑制。这也意味着你应该尽可能晚地调用 fix(),以便所有轴都按最终的方式绘制。最后(正如问题中已经说明的那样),'axes.unicode_minus' 已设置为 False,以解决减号的类似问题。
结果图像: test.png 敏锐的 LaTeX 眼睛可能会注意到 xticklabels 中的负号仍然有些问题。这与问题无关,但发生这种情况是因为 xticklabels 中的数字没有被包含在 $...$ 中。
matplotlib 3.1.0 的更新:
从 matplotlib 版本 3.1.0 开始,警告通过 logging 模块发出,而不是 warnings。要消除警告,请替换:
    # Force the figure to be drawn
    with warnings.catch_warnings():
        warnings.simplefilter('ignore', category=MathTextWarning)
        fig.canvas.draw()

使用

    # Force the figure to be drawn
    import logging
    logger = logging.getLogger('matplotlib.mathtext')
    original_level = logger.getEffectiveLevel()
    logger.setLevel(logging.ERROR)
    with warnings.catch_warnings():
        warnings.simplefilter('ignore', category=MathTextWarning)
        fig.canvas.draw()
    logger.setLevel(original_level)

现在无论是通过logging还是warnings发出的警告,都将被忽略。


1
为了掩盖警告,我使用了 filterwarnings() 处理消息。 import warnings warnings.filterwarnings("ignore", message="Glyph 146 missing from current font.") 因此,请用您自己的错误消息替换 "当前字体缺少字形 146"。

网页内容由stack overflow 提供, 点击上面的
可以查看英文原文,
原文链接