我在SO上搜索了很久,也查询了Google和Matplotlib文档,但都没有找到如何格式化这个文本的方法。我正在创建一个图形,并以2x2矩阵格式添加4个子图,因此我想将所有文字缩小: 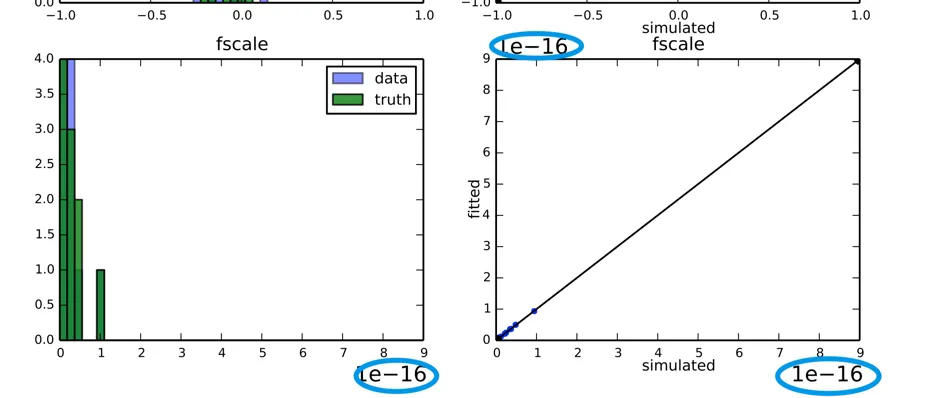
fig = plt.figure()
ax1 = fig.add_subplot(221)
ax1.tick_params(labelsize='xx-small')
ax1.set_title(v, fontdict={'fontsize':'small'})
ax1.hist(results[v], histtype='bar', label='data', bins=bins, alpha=0.5)
ax1.hist(results[v+'_sim'], histtype='bar', label='truth', bins=bins, alpha=0.8)
ax1.legend(loc='best', fontsize='x-small')