我想知道如何在matplotlib中显式设置colorbar对象的格式。以下是一个绘图脚本示例:
from matplotlib import pyplot
from matplotlib.ticker import MultipleLocator, FormatStrFormatter
from matplotlib.colors import BoundaryNorm
from matplotlib.ticker import MaxNLocator
from pylab import *
import numpy as np
import random

# ----------

plot_aspect = 1.2
plot_height = 10.0
plot_width = int(plot_height*plot_aspect)

# ----------

pyplot.figure(figsize=(plot_width, plot_height), dpi=100)
pyplot.subplots_adjust(left=0.10, right=1.00, top=0.90, bottom=0.06, hspace=0.30)
subplot1 = pyplot.subplot(111)

# ----------

cbar_max = 40.0
cbar_min = 20.0
cbar_step = 1.0
cbar_num_colors = 200
cbar_num_format = "%d"

# ----------
# make random dataset

dx, dy = 5.0, 5.0
y, x = np.mgrid[slice(-100.0, 100.0 + dy, dy),slice(-100.0, 100.0 + dx, dx)]

z = []
for i in x:
    z.append([])
    for j in y:
        z[-1].append(random.uniform(cbar_min,cbar_max))

# ----------
# make random dataset

levels = MaxNLocator(nbins=cbar_num_colors).tick_values(cbar_min, cbar_max)
cmap = pyplot.get_cmap('gist_ncar')
norm = BoundaryNorm(levels, ncolors=cmap.N, clip=True)
pp = pyplot.contourf(x,y,z,levels=levels,cmap=cmap)
cbar = pyplot.colorbar(pp, orientation='vertical', ticks=np.arange(cbar_min, cbar_max+cbar_step, cbar_step), format=cbar_num_format)
cbar.ax.set_ylabel('Color Scale [unit]', fontsize = 16, weight="bold")

CS = pyplot.contour(x,y,z, alpha=0.5)

majorLocator1   = MultipleLocator(10)
majorFormatter1 = FormatStrFormatter('%d')
minorLocator1   = MultipleLocator(5)

subplot1.xaxis.set_major_locator(majorLocator1)
subplot1.xaxis.set_major_formatter(majorFormatter1)
subplot1.xaxis.set_minor_locator(minorLocator1)

pyplot.xticks(fontsize = 16)
pyplot.xlim(-100.0,100.0)

majorLocator2   = MultipleLocator(10)
majorFormatter2 = FormatStrFormatter('%d')
minorLocator2   = MultipleLocator(5)

subplot1.yaxis.set_major_locator(majorLocator2)
subplot1.yaxis.set_major_formatter(majorFormatter2)
subplot1.yaxis.set_minor_locator(minorLocator2)

pyplot.yticks(fontsize = 16)
pyplot.ylim(-100.0,100.0)

subplot1.xaxis.grid()
subplot1.yaxis.grid()
subplot1.axes.set_aspect('equal')

pyplot.suptitle('Main Title', fontsize = 24, weight="bold")

pyplot.xlabel('X [unit]', fontsize=16, weight="bold")
pyplot.ylabel('Y [unit]', fontsize=16, weight="bold")

pyplot.show()
pyplot.close()
这使我得到了如下输出:
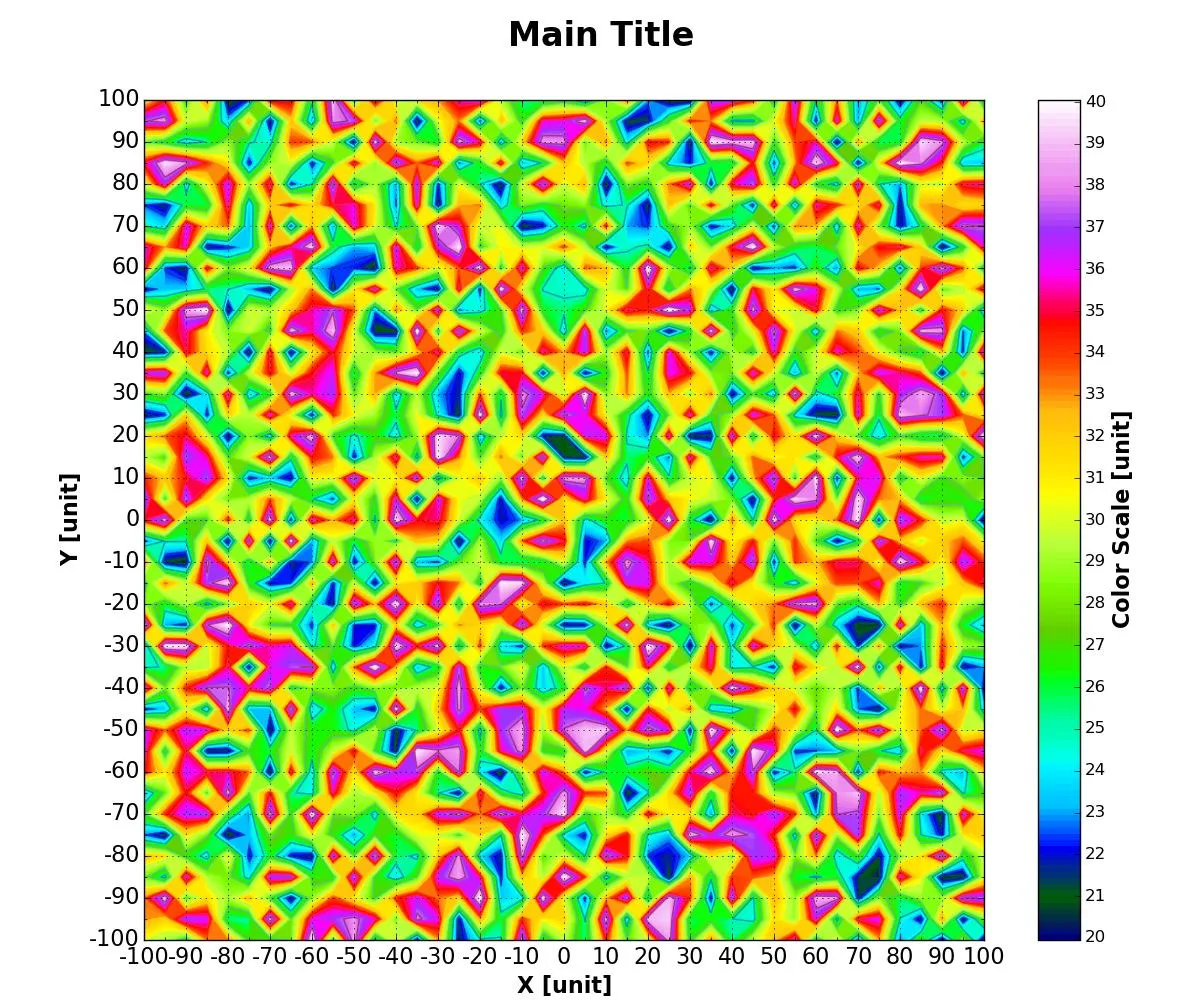
目前颜色条刻度标签格式化将使用之前提供的格式字符串:cbar_num_format =“%d”,但我也想使用以下内容设置字体大小和权重:
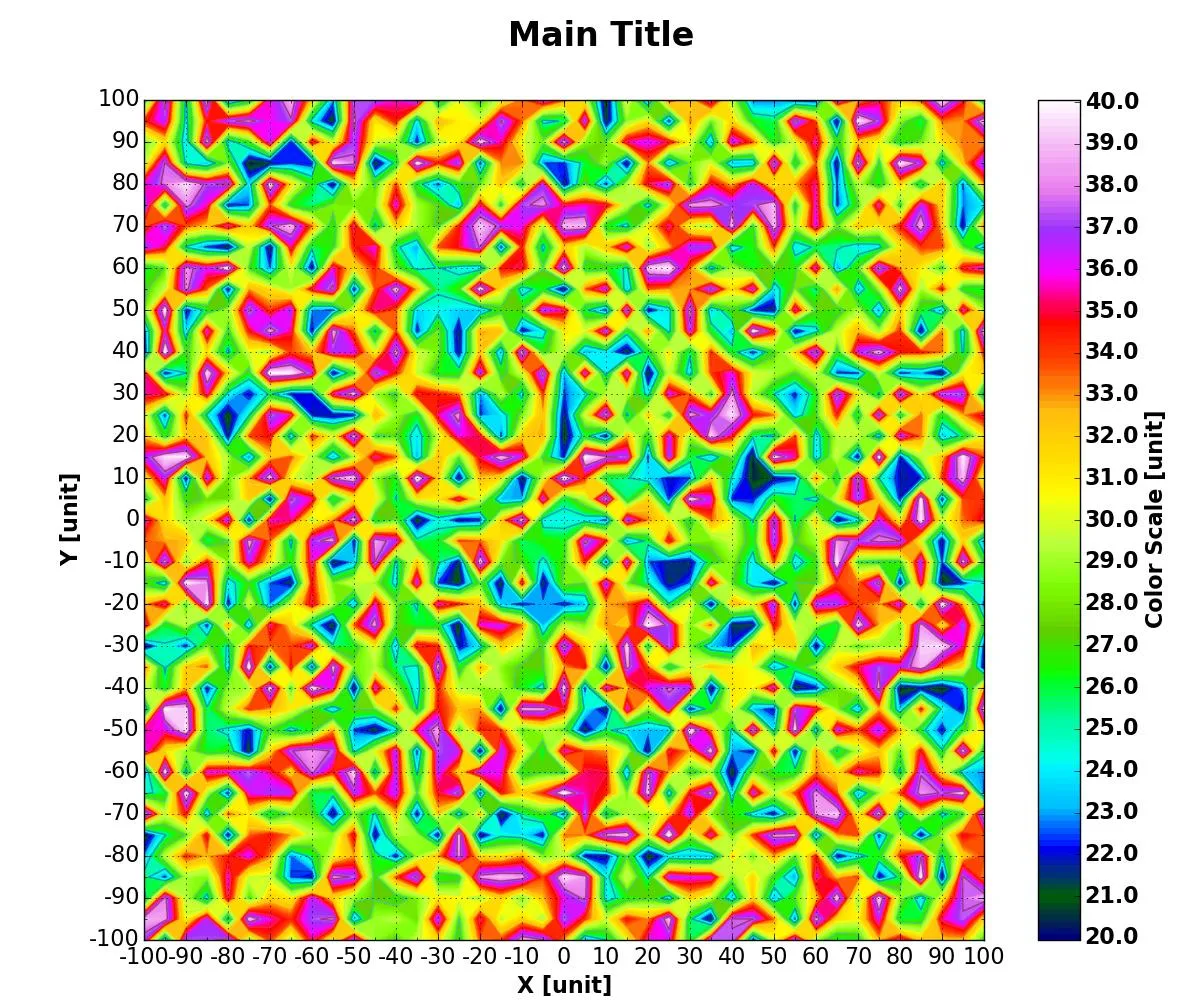
cbar.ax.set_yticklabels(np.arange(cbar_min, cbar_max+cbar_step, cbar_step), fontsize=16, weight='bold')
...但是当我这样做时,之前应用的格式化字符串似乎消失了,数字又回到了"%0.1f"格式,而不是我之前应用的"%d"格式:
我如何防止这种情况发生或更好地控制色条刻度标签?
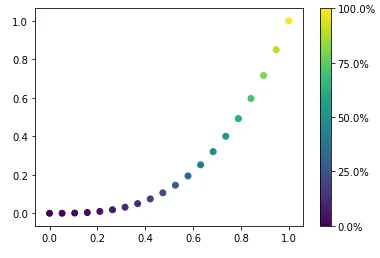
FuncFormatter中包装。这个可以工作:plt.colorbar(format=lambda x, _: f"{x:.0%}")。 - Janosh