如何在Matplotlib中更改刻度标签的文本方向?

4

我需要使用Matplotlib库来可视化一些数据,并在X轴上使用中文刻度标签。以下是一个例子:

A plot with Chinese tick labels

我想改变标签文本的方向,让图表呈现如下效果:

enter image description here

注意,这不是“文本旋转”,而是关于文本方向的问题。
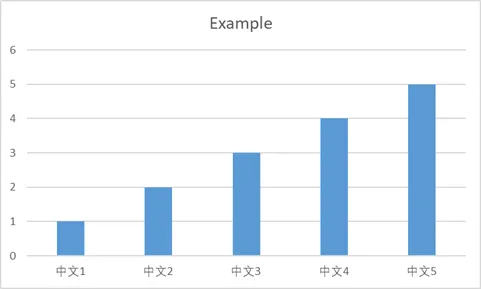
我该如何在Matplotlib中实现呢?
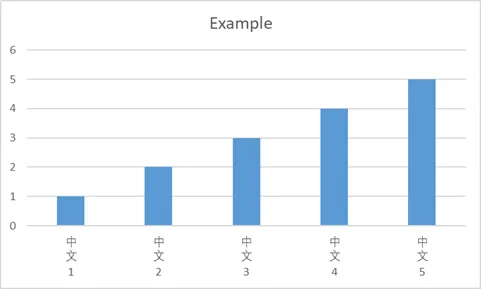
附注: 上述图表是在Excel中创建的,以进行演示。下面是Matplotlib的代码,可以生成类似第一个图表的图形。好吧,我无法在Matplotlib中生成第二个图表,这就是为什么我在这里的原因...
import matplotlib.pyplot as plt
import matplotlib.font_manager as mfont
myfont = mfont.FontProperties('SimHei')

data = [1,2,3,4,5]
labels = ['中文1', '中文2', '中文3', '中文4', '中文5']

fig = plt.figure()
ax = fig.add_subplot(111)
ax.bar(data, data, tick_label=labels)

for label in ax.xaxis.get_majorticklabels():
    label.set(fontproperties=myfont)
plt.show()

我在标签文本中插入了新行,然后得到了如下图所示的绘图:
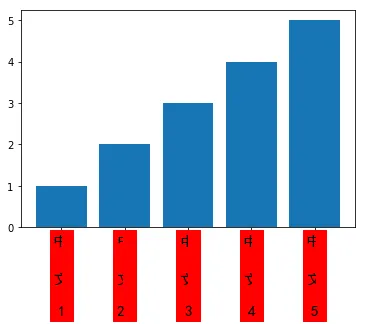
 enter image description here 有些东西遮挡了文本。
上述绘图的代码:
import matplotlib.pyplot as plt
import matplotlib.font_manager as mfont
# myfont = mfont.FontProperties('SimHei', size=30)

data = [1,2,3,4,5]
labels = ['中\n文\n1', '中\n文\n2 ', '中\n文\n3', '中\n文\n4', '中\n文\n5']

fig = plt.figure()
fig.set_facecolor('white')
ax = fig.add_subplot(111)
ax.bar(data, data, tick_label=labels)

for label in ax.xaxis.get_majorticklabels():
    label.set(family='SimHei', size=15, backgroundcolor='red', linespacing=3)
plt.show()

你能分享一下生成这张图的代码吗? - Ernest S Kirubakaran
1
没问题。代码已经添加了。 - Gödel
1
你能在标签字符串中添加新行吗? - Fantastic Mr Fox
我已经尝试过这种方法,但效果不太好。无论如何,感谢你的建议。 - Gödel
我在 https://github.com/matplotlib/matplotlib/issues/15576 报告了类似的问题,由 matplotlib 贡献者 @anntzer 在 https://github.com/matplotlib/matplotlib/pull/14705 中提供了解决方法/修复。 - Vadim Kantorov
3个回答

4

visit:

https://matplotlib.org/gallery/ticks_and_spines/ticklabels_rotation.html

example:

import matplotlib.pyplot as plt

x = [1, 2, 3, 4]
y = [1, 4, 9, 6]
labels = ['Frogs', 'Hogs', 'Bogs', 'Slogs']

plt.plot(x, y, 'ro')

您可以指定刻度标签的旋转角度或使用关键字进行旋转。

plt.xticks(x, labels, rotation='vertical')

增加填充边距,以防标记被轴裁剪

plt.margins(0.2)

调整间距以防止刻度标签被截断。
plt.subplots_adjust(bottom=0.15)
plt.show()

2

我认为在matplotlib中没有任何选项可以垂直打印文本。不过,你可以通过在要打印的文本中插入换行符来进行简单的处理。

import matplotlib.pyplot as plt
import matplotlib.font_manager as mfont
myfont = mfont.FontProperties('SimHei')

data = [1,2,3,4,5]
labels = ['中\n文\n1', '中\n文\n2', '中\n文\n3', '中\n文\n4', '中\n文\n5']

fig = plt.figure()
ax = fig.add_subplot(111)
ax.bar(data, data, tick_label=labels)

for label in ax.xaxis.get_majorticklabels():
    label.set(fontproperties=myfont)
plt.show()

我尝试过这种方法。但是它效果不是很好。感谢你的回答。 - Gödel
你对这种方法有什么具体的问题吗? - Ernest S Kirubakaran
它只显示了每个汉字的一半。 - Gödel

1

在打印刻度时,将每个单词放在新行中的解决方法。

labels = ['\n'.join(list(tick)) for tick in labels ]

你能展示一下这个代码生成的图片吗?我怀疑这会旋转标签,而原帖中明确要求不要这样做。 - Fantastic Mr Fox
非常感谢。这种方法对我来说效果不佳。也许在Matplotlib中不支持。 - Gödel

网页内容由stack overflow 提供, 点击上面的
可以查看英文原文,
原文链接