您可以通过将元素总数除以直方图中的每个元素来将其归一化:
[n1,x1] = histcounts(randn(69,1));
[n2,x2] = histcounts(randn(23,1));
[n3,x3] = histcounts(randn(10,1));
[n4,x4] = histcounts(randn(10,1));
hold on
bar(x4(1:end-1),n4./sum(n4),'histc');
bar(x3(1:end-1),n3./sum(n3),'histc');
bar(x2(1:end-1),n2./sum(n2),'histc');
bar(x1(1:end-1),n1./sum(n1),'histc');
hold off
ax = gca;
set(ax.Children,{'FaceColor'},mat2cell(lines(4),ones(4,1),3))
set(ax.Children,{'FaceAlpha'},repmat({0.7},4,1))
然而,正如您在上面看到的那样,您可以做一些事情使您的代码更简单和短:
- 您只需要执行
hold on一次。 - 使用
axes句柄代替收集所有的bar句柄。 - 按数据集中元素数量的升序绘制条形图,以便所有直方图都清晰可见。
- 使用
axes句柄设置所有属性。
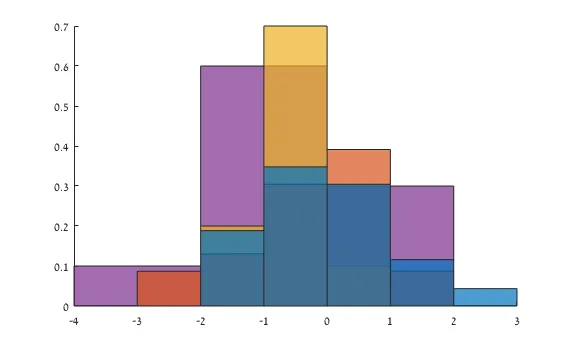
顺便说一句 - 最好使用
histcounts。这是结果:
编辑:
如果您想同时绘制来自histfit的pdf线,则可以先保存它,然后绘制标准化的线:
dataset = {randn(69,1),randn(23,1),randn(10,1),randn(10,1)};
fits = zeros(100,2,numel(dataset));
hold on
for k = numel(dataset):-1:1
total = numel(dataset{k});
f = histfit(dataset{k});
fits(:,:,k) = [f(2).XData; f(2).YData./total].';
x = f(1).XData;
n = f(1).YData;
f.delete
bar(x,n./total,'histc');
end
ax = gca;
set(ax.Children,{'FaceColor'},mat2cell(lines(4),ones(4,1),3))
set(ax.Children,{'FaceAlpha'},repmat({0.7},4,1))
plot(squeeze(fits(:,1,:)),squeeze(fits(:,2,:)),'LineWidth',3)
hold off
还有一些其他的改进可以引入到你的代码中:
- 将所有内容放入循环中,以便以后更容易进行更改。
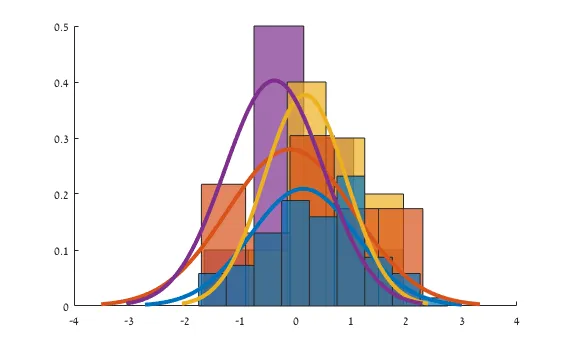
- 将所有曲线数据收集到一个变量中,这样您就可以非常容易地将它们全部绘制在一起。
新的结果是:
n1/sum(n1)来代替bar?否则,histogram(x,'Normalization','probability')可以作为另一种选择。 - Florian