import numpy as np, matplotlib.pyplot as plt
data = np.random.rand(1000)+5.0
plt.plot(data)
plt.xlabel('observation number')
plt.ylabel('recorded value')
plt.show()
import numpy as np, matplotlib.pyplot as plt
data = np.random.rand(1000)+5.0
plt.plot(data)
plt.xlabel('observation number')
plt.ylabel('recorded value')
plt.show()
使用百分位数
的问题在于,被识别为异常值的数据点取决于你的样本大小。
有很多方法可以检测异常值,你应该考虑如何对它们进行分类。理想情况下,你应该使用先验信息(例如,“任何高于/低于这个值都是不现实的,因为……”)
然而,一种常见但不太不合理的异常值测试方法是基于“中位数绝对偏差”来删除数据点。
以下是N维情况下的实现(从某篇论文代码中获取:https://github.com/joferkington/oost_paper_code/blob/master/utilities.py):
def is_outlier(points, thresh=3.5):
"""
Returns a boolean array with True if points are outliers and False
otherwise.
Parameters:
-----------
points : An numobservations by numdimensions array of observations
thresh : The modified z-score to use as a threshold. Observations with
a modified z-score (based on the median absolute deviation) greater
than this value will be classified as outliers.
Returns:
--------
mask : A numobservations-length boolean array.
References:
----------
Boris Iglewicz and David Hoaglin (1993), "Volume 16: How to Detect and
Handle Outliers", The ASQC Basic References in Quality Control:
Statistical Techniques, Edward F. Mykytka, Ph.D., Editor.
"""
if len(points.shape) == 1:
points = points[:,None]
median = np.median(points, axis=0)
diff = np.sum((points - median)**2, axis=-1)
diff = np.sqrt(diff)
med_abs_deviation = np.median(diff)
modified_z_score = 0.6745 * diff / med_abs_deviation
return modified_z_score > thresh
这与我之前的一个回答非常相似(链接),但我想详细说明样本量效应。
让我们比较一种基于百分位数的异常值检测方法(类似于@CTZhu的回答),以及用于各种不同样本大小的中位数绝对偏差(MAD)检测方法:
import numpy as np
import matplotlib.pyplot as plt
import seaborn as sns
def main():
for num in [10, 50, 100, 1000]:
# Generate some data
x = np.random.normal(0, 0.5, num-3)
# Add three outliers...
x = np.r_[x, -3, -10, 12]
plot(x)
plt.show()
def mad_based_outlier(points, thresh=3.5):
if len(points.shape) == 1:
points = points[:,None]
median = np.median(points, axis=0)
diff = np.sum((points - median)**2, axis=-1)
diff = np.sqrt(diff)
med_abs_deviation = np.median(diff)
modified_z_score = 0.6745 * diff / med_abs_deviation
return modified_z_score > thresh
def percentile_based_outlier(data, threshold=95):
diff = (100 - threshold) / 2.0
minval, maxval = np.percentile(data, [diff, 100 - diff])
return (data < minval) | (data > maxval)
def plot(x):
fig, axes = plt.subplots(nrows=2)
for ax, func in zip(axes, [percentile_based_outlier, mad_based_outlier]):
sns.distplot(x, ax=ax, rug=True, hist=False)
outliers = x[func(x)]
ax.plot(outliers, np.zeros_like(outliers), 'ro', clip_on=False)
kwargs = dict(y=0.95, x=0.05, ha='left', va='top')
axes[0].set_title('Percentile-based Outliers', **kwargs)
axes[1].set_title('MAD-based Outliers', **kwargs)
fig.suptitle('Comparing Outlier Tests with n={}'.format(len(x)), size=14)
main()
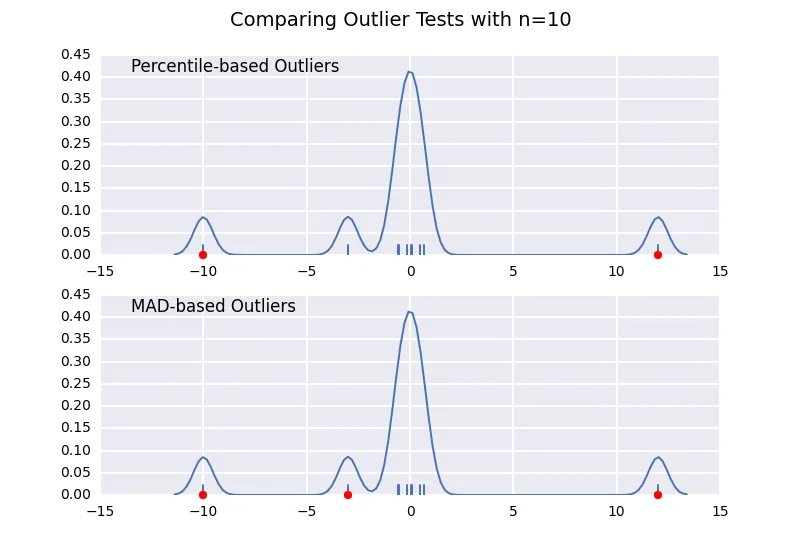
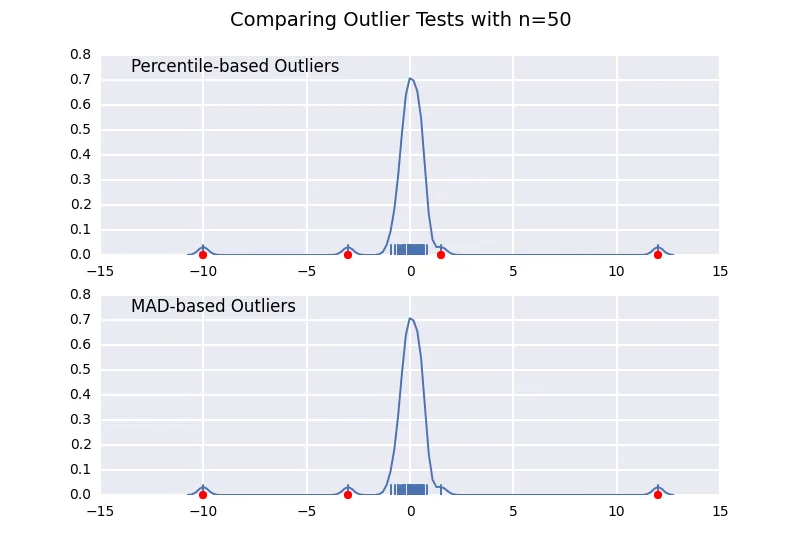
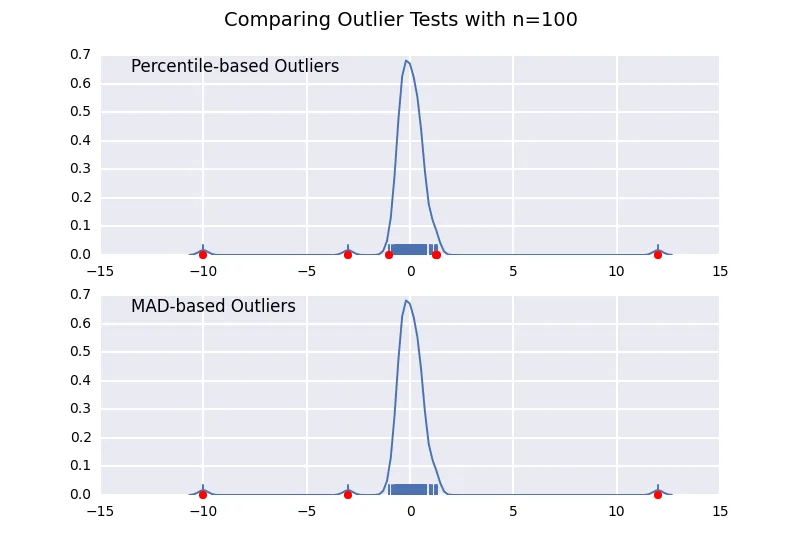
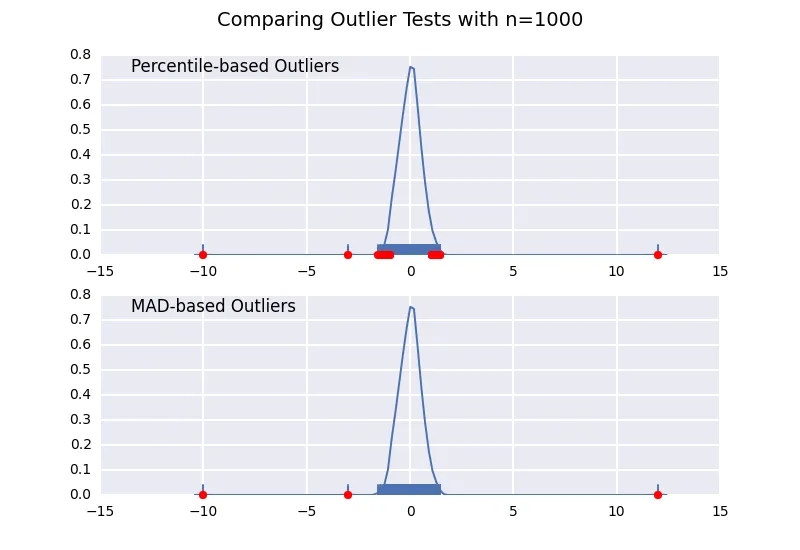
请注意,基于MAD的分类器可以正确地处理各种样本大小,而基于百分位数的分类器会将更多的数据点归类为异常值,无论它们是否真正是异常值,且随着样本大小的增加而增加。
random.rand()
),还是大部分时间遵循其他某种分布。如果数据始终是均匀扰动的,我不确定是否可以使用 MAD
。 - CT Zhu在一维数据中检测异常值取决于其分布。
1- 正态分布:
另一种方法是预测区间,如果您想要数据点的置信区间而不是平均值置信区间。
数据值随机分布在一定范围内:平均值可能不是数据的公正代表,因为平均值很容易受到异常值(数据集中不典型的非常小或大的值)的影响。中位数是衡量数字数据集中心的另一种方法。
中位数绝对离差 - 一种以中位数距离为单位度量所有点与中位数之间距离的方法。 http://www.itl.nist.gov/div898/handbook/eda/section3/eda35h.htm(如Joe Kington的答案所述)有良好的解释。
2- 对称分布: 再次使用中位数绝对离差是一种很好的方法,如果根据z得分计算和阈值进行更改。
解释:http://eurekastatistics.com/using-the-median-absolute-deviation-to-find-outliers/
3- 非对称分布:双MAD - 双中位数绝对离差。在上面附加的链接中有解释。
附上我的Python代码供参考:
def is_outlier_doubleMAD(self,points):
"""
FOR ASSYMMETRIC DISTRIBUTION
Returns : filtered array excluding the outliers
Parameters : the actual data Points array
Calculates median to divide data into 2 halves.(skew conditions handled)
Then those two halves are treated as separate data with calculation same as for symmetric distribution.(first answer)
Only difference being , the thresholds are now the median distance of the right and left median with the actual data median
"""
if len(points.shape) == 1:
points = points[:,None]
median = np.median(points, axis=0)
medianIndex = (points.size/2)
leftData = np.copy(points[0:medianIndex])
rightData = np.copy(points[medianIndex:points.size])
median1 = np.median(leftData, axis=0)
diff1 = np.sum((leftData - median1)**2, axis=-1)
diff1 = np.sqrt(diff1)
median2 = np.median(rightData, axis=0)
diff2 = np.sum((rightData - median2)**2, axis=-1)
diff2 = np.sqrt(diff2)
med_abs_deviation1 = max(np.median(diff1),0.000001)
med_abs_deviation2 = max(np.median(diff2),0.000001)
threshold1 = ((median-median1)/med_abs_deviation1)*3
threshold2 = ((median2-median)/med_abs_deviation2)*3
#if any threshold is 0 -> no outliers
if threshold1==0:
threshold1 = sys.maxint
if threshold2==0:
threshold2 = sys.maxint
#multiplied by a factor so that only the outermost points are removed
modified_z_score1 = 0.6745 * diff1 / med_abs_deviation1
modified_z_score2 = 0.6745 * diff2 / med_abs_deviation2
filtered1 = []
i = 0
for data in modified_z_score1:
if data < threshold1:
filtered1.append(leftData[i])
i += 1
i = 0
filtered2 = []
for data in modified_z_score2:
if data < threshold2:
filtered2.append(rightData[i])
i += 1
filtered = filtered1 + filtered2
return filtered
medianIndex = int(points.size/2)
。另外,如果我运行代码并将阈值设置为零,则会崩溃并显示消息“name 'sys' is not defined”。最后,在函数调用中的self
从未被使用。 - Eulenfuchswiesel我已经根据http://eurekastatistics.com/using-the-median-absolute-deviation-to-find-outliers的代码进行了改编,它给出了与Joe Kington相同的结果,但使用的是L1距离而不是L2距离,并支持非对称分布。原始的R代码没有Joe的0.6745乘数,所以我也加入了该乘数以保证一致性。不确定是否完全必要,但可以使比较更准确。
def doubleMADsfromMedian(y,thresh=3.5):
# warning: this function does not check for NAs
# nor does it address issues when
# more than 50% of your data have identical values
m = np.median(y)
abs_dev = np.abs(y - m)
left_mad = np.median(abs_dev[y <= m])
right_mad = np.median(abs_dev[y >= m])
y_mad = left_mad * np.ones(len(y))
y_mad[y > m] = right_mad
modified_z_score = 0.6745 * abs_dev / y_mad
modified_z_score[y == m] = 0
return modified_z_score > thresh
y_mad[y < m]
替换为 y_mad[y <= m]
,并将 y_mad[y > m]
替换为 y_mad[y >= m]
,否则当 y 等于 m 时,y_mad 将为零。 - Jin一个简单的解决方案是,移除超过2个标准差(或1.96)之外的内容:
import random
def outliers(tmp):
"""tmp is a list of numbers"""
outs = []
mean = sum(tmp)/(1.0*len(tmp))
var = sum((tmp[i] - mean)**2 for i in range(0, len(tmp)))/(1.0*len(tmp))
std = var**0.5
outs = [tmp[i] for i in range(0, len(tmp)) if abs(tmp[i]-mean) > 1.96*std]
return outs
lst = [random.randrange(-10, 55) for _ in range(40)]
print lst
print outliers(lst)
xrange
? - Mohsen_Fatemi如@Martin所建议,使用np.percentile
:
percentiles = np.percentile(data, [2.5, 97.5])
# or =>, <= for within 95%
data[(percentiles[0]<data) & (percentiles[1]>data)]
# set the outliners to np.nan
data[(percentiles[0]>data) | (percentiles[1]<data)] = np.nan
numpy
的范围。(numpy
本身只包含核心数据结构和一些基本操作。它故意保持小巧。)你可以认为scipy.stats
是一个合理的异常值测试位置,但有许多这样的测试,并没有单一的最佳测试。因此,目前没有单一功能的异常值测试。 - Joe Kingtonsm.robust.mad
中具有中位数绝对偏差函数。我不确定是否有针对单变量异常值检验的工具,但是在回归框架中存在影响/异常值的工具。将研究添加一些用于单变量异常值检测的工具。 - jseabold