在matplotlib图中显示原始坐标轴(x,y)

73
我有一个简单的图表,我想要显示原点轴(x,y)。 我已经有了网格,但我需要强调x,y轴。 这是我的代码:
x = linspace(0.2,10,100)
plot(x, 1/x)
plot(x, log(x))
axis('equal')
grid()

我看到了这个问题。 接受的答案建议使用“Axis spine”,并提供了一些示例链接。 但是示例太复杂了,使用了子图。 我无法弄清楚如何在我的简单示例中使用“Axis spine”。

3个回答

120

使用subplots并不太复杂,但是轴线可能会让人困惑。

愚蠢、简单的方法:

%matplotlib inline
import numpy as np
import matplotlib.pyplot as plt

x = np.linspace(0.2,10,100)
fig, ax = plt.subplots()
ax.plot(x, 1/x)
ax.plot(x, np.log(x))
ax.set_aspect('equal')
ax.grid(True, which='both')

ax.axhline(y=0, color='k')
ax.axvline(x=0, color='k')

然后我得到:

with axlines

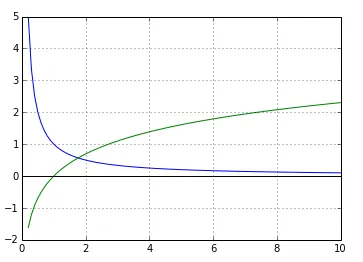
由于x轴的下限为零,因此您无法看到垂直轴。
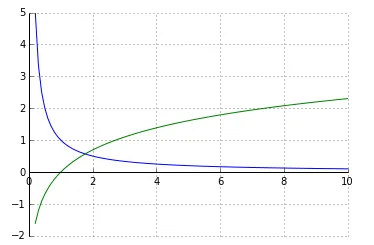
使用简单脊柱的替代方法

%matplotlib inline
import numpy as np
import matplotlib.pyplot as plt

x = np.linspace(0.2,10,100)
fig, ax = plt.subplots()
ax.plot(x, 1/x)
ax.plot(x, np.log(x))
ax.set_aspect('equal')
ax.grid(True, which='both')

# set the x-spine (see below for more info on `set_position`)
ax.spines['left'].set_position('zero')

# turn off the right spine/ticks
ax.spines['right'].set_color('none')
ax.yaxis.tick_left()

# set the y-spine
ax.spines['bottom'].set_position('zero')

# turn off the top spine/ticks
ax.spines['top'].set_color('none')
ax.xaxis.tick_bottom()

with_spines

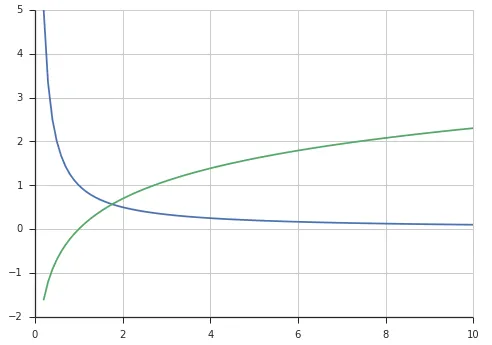
使用 seaborn 进行替代(我最喜欢的)

import numpy as np
import matplotlib.pyplot as plt
import seaborn
seaborn.set(style='ticks')

x = np.linspace(0.2,10,100)
fig, ax = plt.subplots()
ax.plot(x, 1/x)
ax.plot(x, np.log(x))
ax.set_aspect('equal')
ax.grid(True, which='both')
seaborn.despine(ax=ax, offset=0) # the important part here

with_seaborn

使用脊柱的set_position方法

这里是关于spines的set_position方法的文档:

脊柱位置由2元组(位置类型,数量)指定。位置类型包括:

  • 'outward':将脊柱从数据区域向外移动指定数量的点。(负值表示向内移动脊柱。)

  • 'axes':将脊柱放置在指定的轴坐标处(从0.0-1.0)。

  • 'data':将脊柱放置在指定的数据坐标处。

此外,速记符号定义了特殊位置:

  • 'center' -> ('axes',0.5)
  • 'zero' -> ('data', 0.0)

因此,您可以使用以下代码将左侧脊柱放置在任何位置:

ax.spines['left'].set_position((system, poisition))

其中system可以是'outward'、'axes'或者'data',而position则是在该坐标系中的位置。


7

这个问题被提出已经有一段时间了。使用Matplotlib 3.6.2,它看起来可以正常工作:

plt.axhline(0, color='black', linewidth=.5)
plt.axvline(0, color='black', linewidth=.5)

还有其他选项。


1

让我回答这个(相当古老的)问题,为那些像我一样搜索它的人提供帮助。虽然它提供了可行的解决方案,但我认为(唯一提供的)答案在这种简单情况下过于复杂,就像问题描述中所述的那样(注意:此方法要求您指定所有轴端点)。

我在matplotlib pyplot第一个教程中找到了一个简单的工作解决方案。只需在绘图创建后添加以下行

plt.axis([xmin, xmax, ymin, ymax])

如下例所示:

from matplotlib import pyplot as plt

xs = [1,2,3,4,5]
ys = [3,5,1,2,4]

plt.scatter(xs, ys)
plt.axis([0,6,0,6])  #this line does the job
plt.show()

它会产生以下结果:

matplotlib plot with axes endpoints specified


2
用户需要强调x轴和y轴,但您的解决方案似乎只是裁剪轴。这并没有提供问题的解决方案。 - armamut
2
这个解决方案对我有帮助。尽管它裁剪了网格,在这种情况下并不理想(我建议出版商进行编辑),但它确实演示了如何强制轴从特定数字开始,这正是我要寻找的。 - MrJedi2U

网页内容由stack overflow 提供, 点击上面的
可以查看英文原文,
原文链接