Python, Matplotlib自定义坐标轴共享Y轴

3

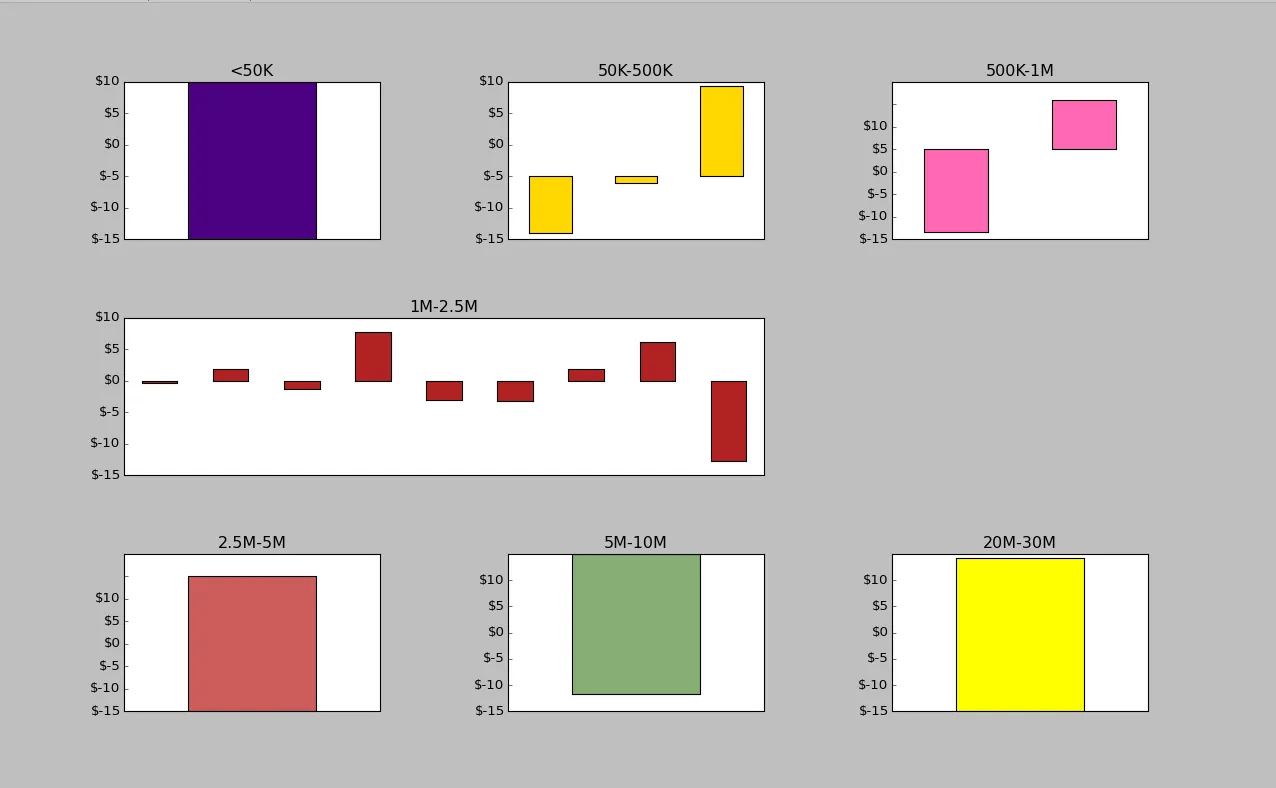
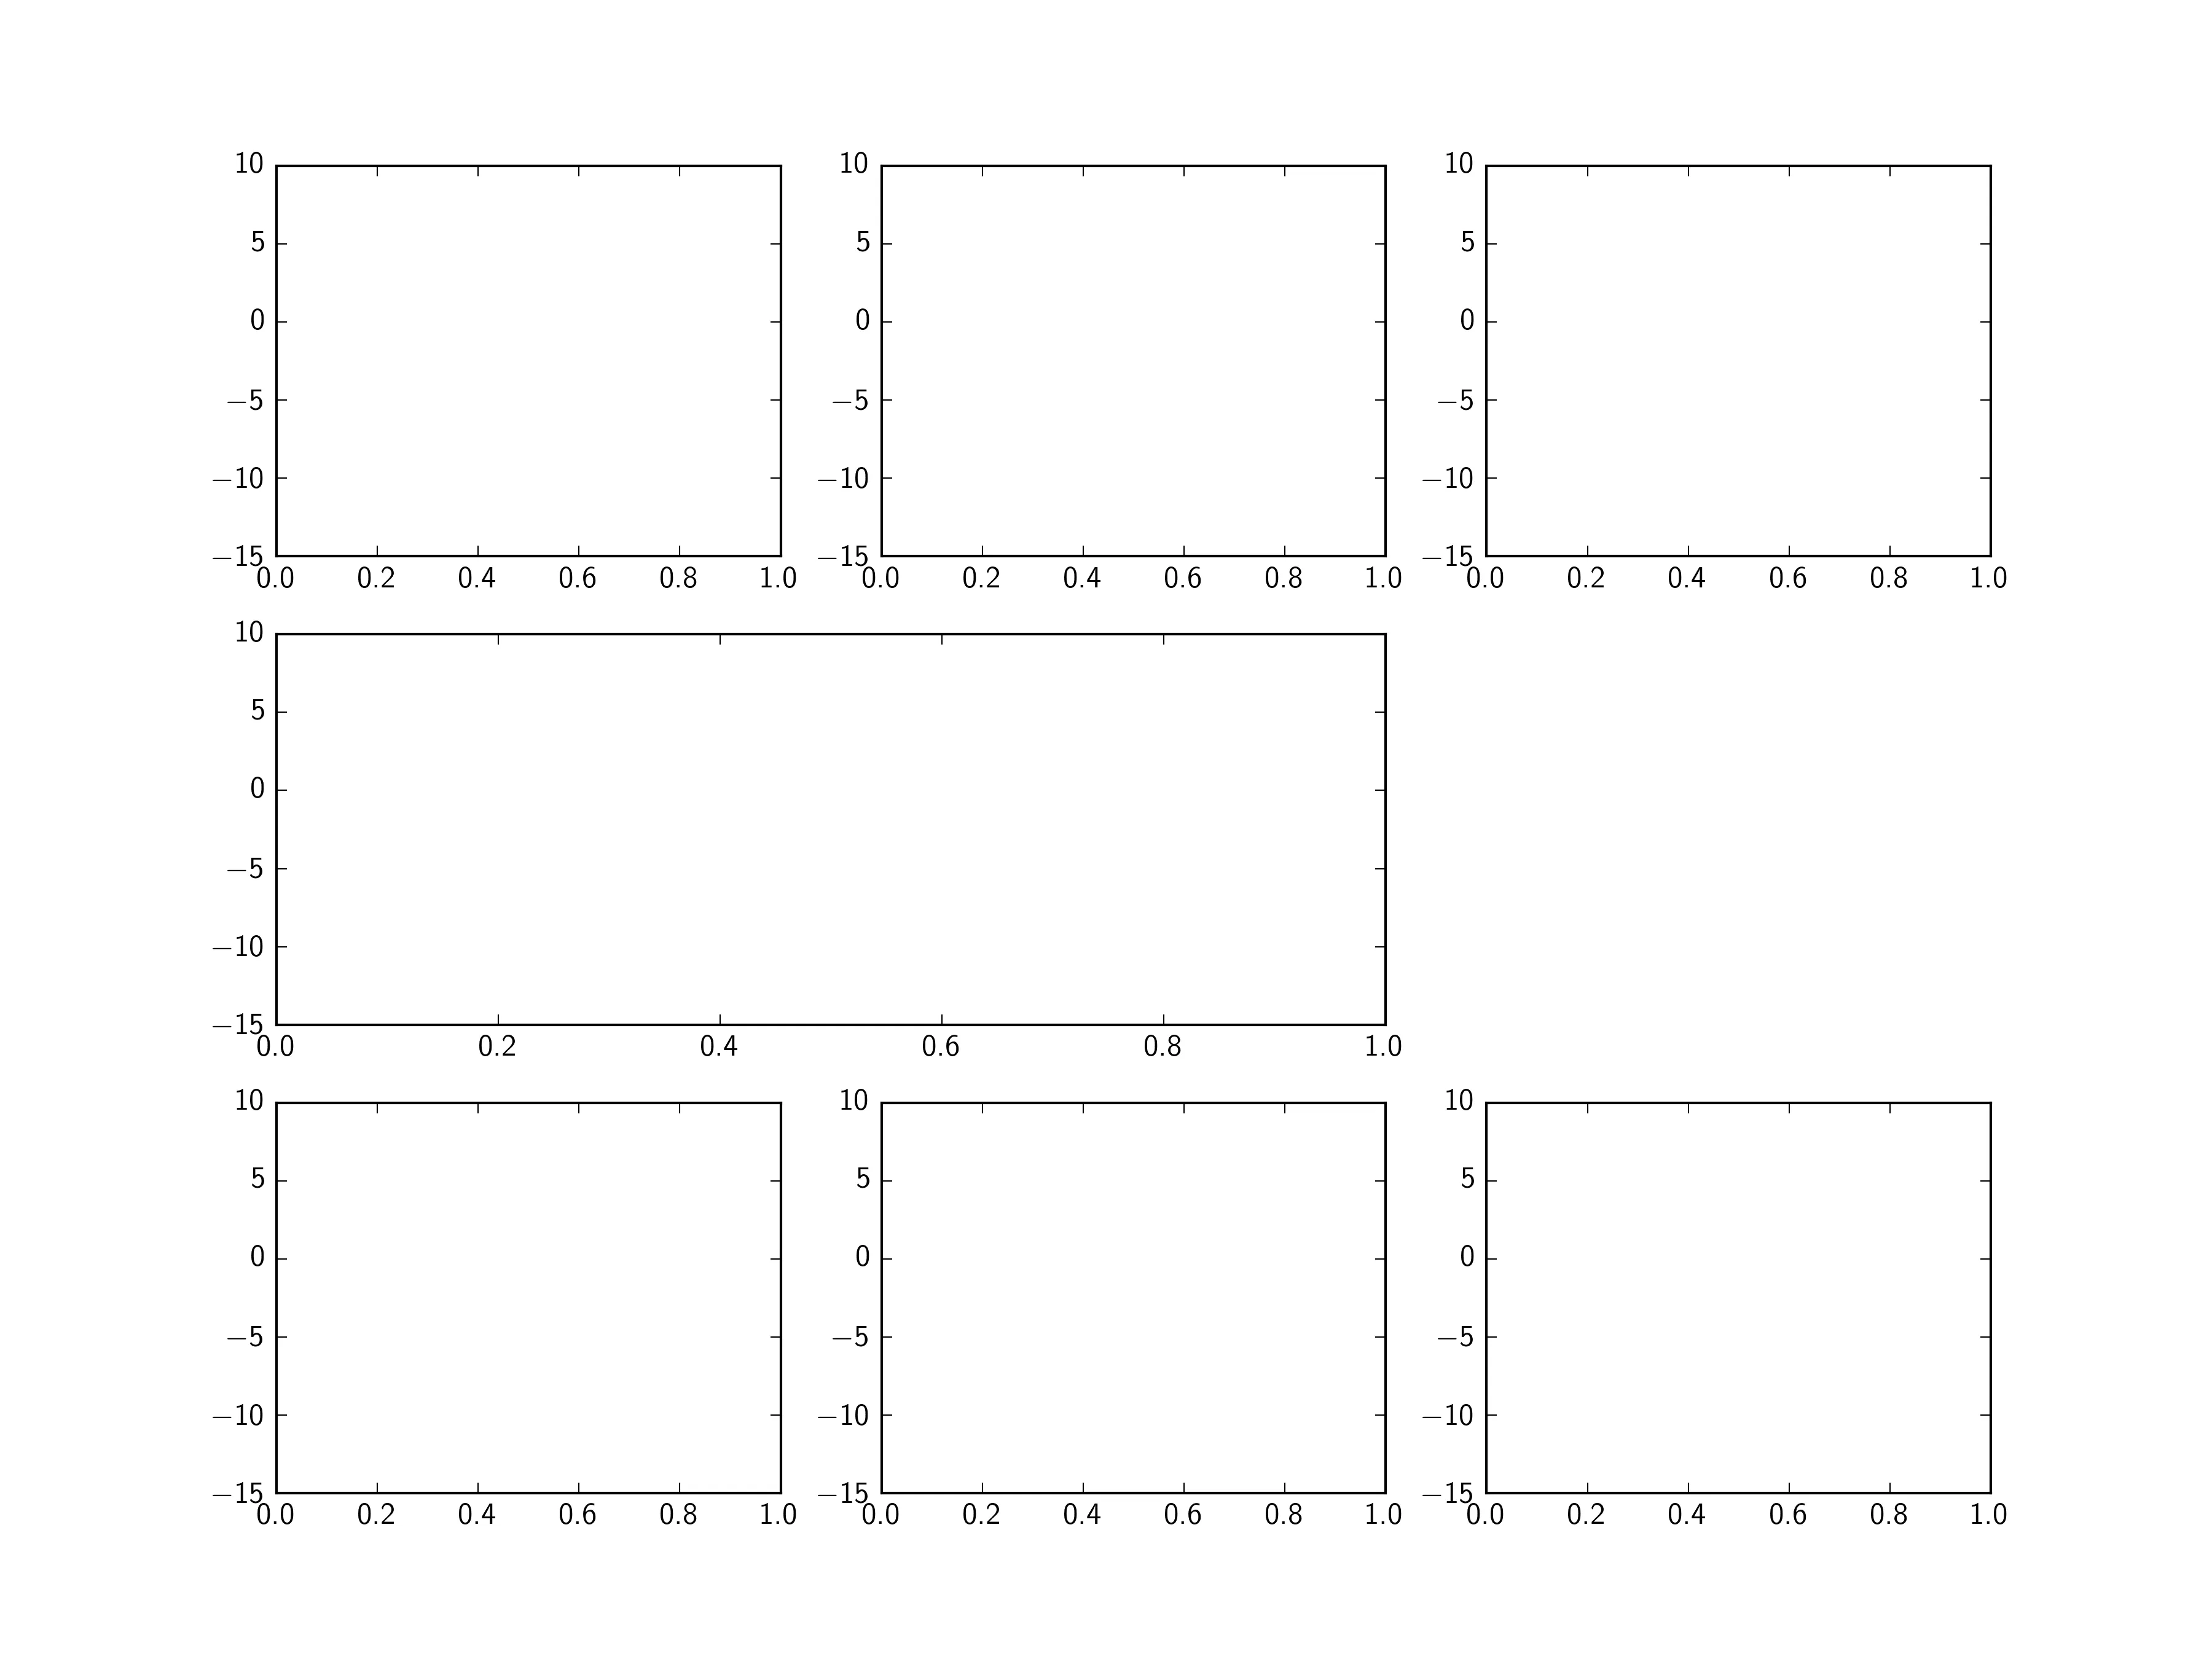
我有一个简单的代码,可以创建一个包含7个轴/自定义子图的图形(我的理解是子图是等大小和等间距的,在我特定的情况下,我需要其中一个比其他子图更大)。

fig = plt.figure(figsize = (16,12))
# row 1
ax1 = plt.axes([0.1,0.7,0.2,0.2])
ax2 = plt.axes([0.4,0.7,0.2,0.2])
ax3 = plt.axes([0.7,0.7,0.2,0.2])
# big row 2
ax4 = plt.axes([0.1, 0.4, 0.5, 0.2])
#row 3
ax5 = plt.axes([0.1,0.1,0.2,0.2])
ax6 = plt.axes([0.4,0.1,0.2,0.2])
ax7 = plt.axes([0.7,0.1,0.2,0.2])

我的问题是,如何使所有这些轴共享同一个y轴。我在谷歌/堆栈上找到的都是针对子图的,例如:

ax = plt.subplot(blah, sharey=True)

但是在创建坐标轴时调用相同的内容却无法工作:
ax = plt.axes([blah], sharey=True) # throws error

有没有方法可以完成这个任务?我正在处理的内容如下所示: 期望的图形布局
1个回答

2

使用matplotlib.gridspec.GridSpec非常简单。

通过gs=GridSpec(3,3)创建一个3x3的网格来放置子图。

对于顶行和底行,我们只需要索引3x3网格上的一个单元格(例如gs[0,0]位于左上角)。

对于中间一行,您需要跨越两列,因此我们使用gs[1,0:2]

import matplotlib.pyplot as plt
from matplotlib.gridspec import GridSpec

fig=plt.figure(figsize=(16,12))

gs = GridSpec(3,3)

# Top row
ax1=fig.add_subplot(gs[0,0])
ax2=fig.add_subplot(gs[0,1],sharey=ax1)
ax3=fig.add_subplot(gs[0,2],sharey=ax1)

# Middle row
ax4=fig.add_subplot(gs[1,0:2],sharey=ax1)

# Bottom row
ax5=fig.add_subplot(gs[2,0],sharey=ax1)
ax6=fig.add_subplot(gs[2,1],sharey=ax1)
ax7=fig.add_subplot(gs[2,2],sharey=ax1)

ax1.set_ylim(-15,10)

plt.show()

enter image description here


网页内容由stack overflow 提供, 点击上面的
可以查看英文原文,
原文链接