我需要将两个子图对齐,但不是在它们的零点上。其他解决方案对我来说并不完全适用。
我的程序主代码如下。子图没有对齐。此外,我只改变align_yaxis函数,保持所有其他代码不变。
import matplotlib.pyplot as plt
def align_yaxis(ax1, v1, ax2, v2):
return 0
x = range(10)
y1 = [3.2, 1.3, -0.3, 0.4, 2.3, -0.9, 0.2, 0.1, 1.3, -3.4]
y2, s = [], 100
for i in y1:
s *= 1 + i/100
y2.append(s)
fig = plt.figure()
ax1 = fig.add_subplot()
ax2 = ax1.twinx()
ax1.axhline(y=0, color='k', linestyle='-', linewidth=0.5)
ax1.bar(x, y1, color='tab:blue')
ax2.plot(x, y2, color='tab:red')
fig.tight_layout()
align_yaxis(ax1, 0, ax2, 100)
plt.show()
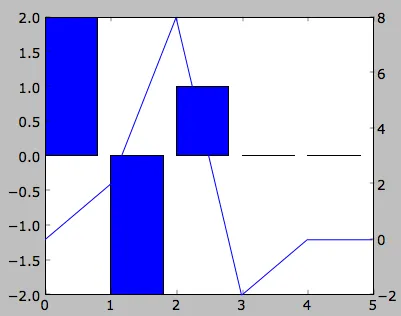
未对齐的子图图片
使用@HYRY的解决方案,我得到了对齐的子图,但第二个子图超出了图形。你看不到它。
def align_yaxis(ax1, v1, ax2, v2):
"""adjust ax2 ylimit so that v2 in ax2 is aligned to v1 in ax1"""
_, y1 = ax1.transData.transform((0, v1))
_, y2 = ax2.transData.transform((0, v2))
inv = ax2.transData.inverted()
_, dy = inv.transform((0, 0)) - inv.transform((0, y1-y2))
miny, maxy = ax2.get_ylim()
ax2.set_ylim(miny+dy, maxy+dy)
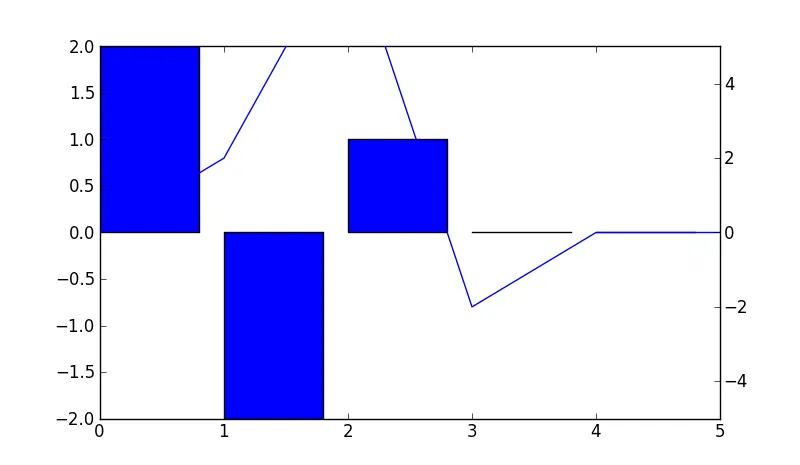
没有第二个子图的图片
使用@drevicko的解决方案,我也得到了对齐的图表。但是现在第一个子图已经不在图片中了,第一个Y轴也很奇怪。
def align_yaxis(ax1, v1, ax2, v2):
    """adjust ax2 ylimit so that v2 in ax2 is aligned to v1 in ax1"""
    _, y1 = ax1.transData.transform((0, v1))
    _, y2 = ax2.transData.transform((0, v2))
    adjust_yaxis(ax2,(y1-y2)/2,v2)
    adjust_yaxis(ax1,(y2-y1)/2,v1)

def adjust_yaxis(ax,ydif,v):
    """shift axis ax by ydiff, maintaining point v at the same location"""
    inv = ax.transData.inverted()
    _, dy = inv.transform((0, 0)) - inv.transform((0, ydif))
    miny, maxy = ax.get_ylim()
    miny, maxy = miny - v, maxy - v
    if -miny>maxy or (-miny==maxy and dy > 0):
        nminy = miny
        nmaxy = miny*(maxy+dy)/(miny+dy)
    else:
        nmaxy = maxy
        nminy = maxy*(miny+dy)/(maxy+dy)
    ax.set_ylim(nminy+v, nmaxy+v)
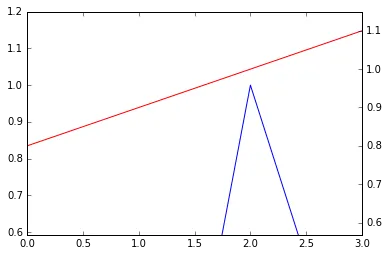
没有第一个子图的图片
所以我稍微调整了@drevicko的解决方案,得到了我想要的结果。
def align_yaxis(ax1, v1, ax2, v2):
    """adjust ax2 ylimit so that v2 in ax2 is aligned to v1 in ax1"""
    _, y1 = ax1.transData.transform((0, v1))
    _, y2 = ax2.transData.transform((0, v2))
    adjust_yaxis(ax1,(y2 - y1)/2,v1)
    adjust_yaxis(ax2,(y1 - y2)/2,v2)

def adjust_yaxis(ax,ydif,v):
    """shift axis ax by ydiff, maintaining point v at the same location"""
    inv = ax.transData.inverted()
    _, dy = inv.transform((0, 0)) - inv.transform((0, ydif))
    miny, maxy = ax.get_ylim()

    nminy = miny - v + dy - abs(dy)
    nmaxy = maxy - v + dy + abs(dy)
    ax.set_ylim(nminy+v, nmaxy+v)
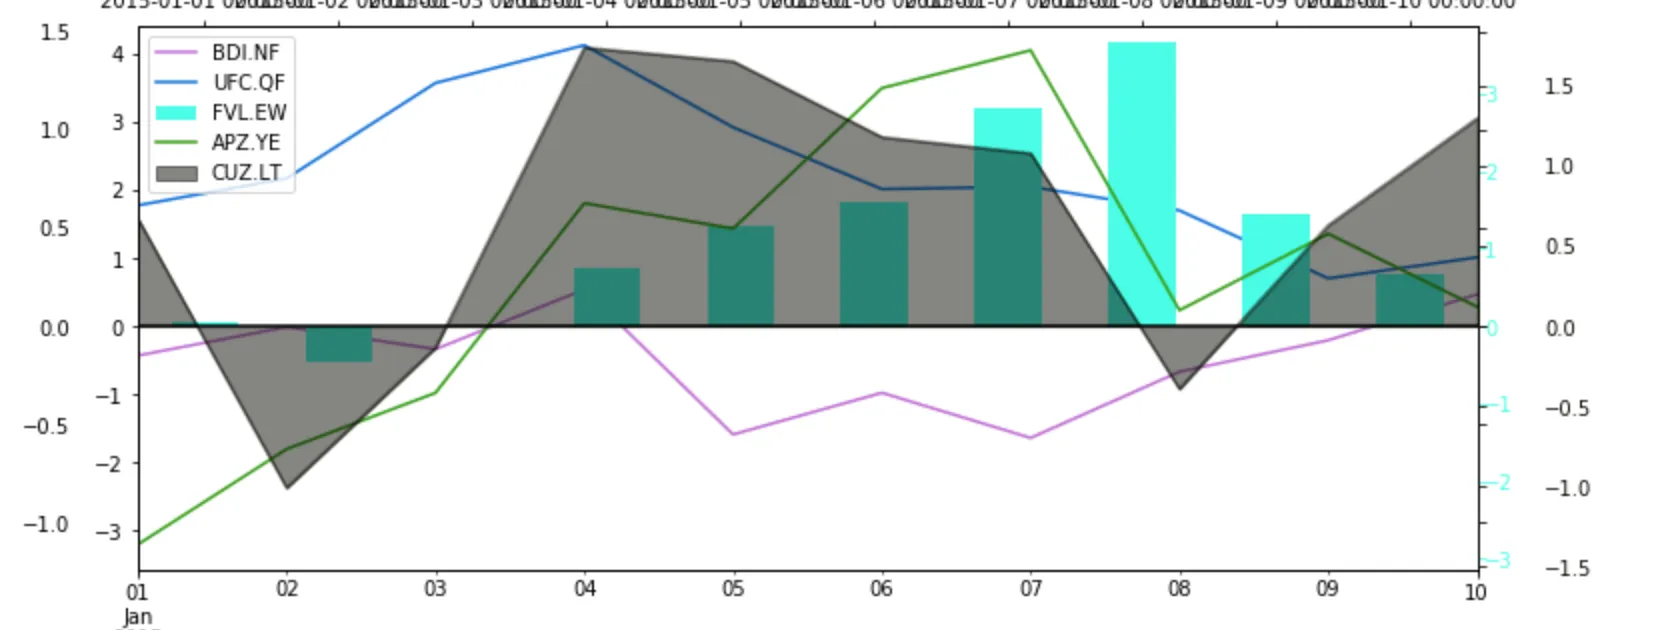
我期望的子图外观