Python + Matplotlib:使用本地化格式设置y轴

5
我希望使用Python 2.7中的Matplotlib格式化y轴。这是我尝试过的内容:
ax.yaxis.get_major_formatter().set_useLocale()

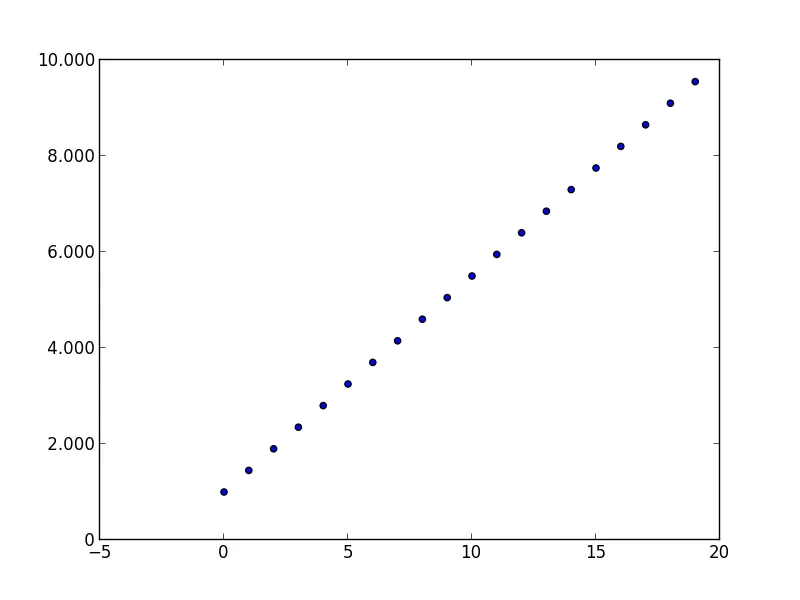
我希望使用.作为千位分隔符来格式化我的y轴。不想显示10000,而是想要10.000,以此类推...但我找不到任何关于如何实现这一点的示例...

我在这个页面上找不到相关文档,也没有示例或进一步的说明:http://matplotlib.org/api/ticker_api.html#matplotlib.ticker.ScalarFormatter.set_useLocale

还有其他任何关于如何格式化我的轴的想法吗?

谢谢


你可以按照以下方式操作:http://tiku.io/questions/1009459/how-to-format-axis-number-format-to-thousands-with-a-comma-in-matplotlib - tommy.carstensen
1个回答

7

我相信你希望拥有比set_useLocale()更多的控制权。 因此,借鉴这里给出的示例,我使用了一个简单的函数来实现FuncFormattercomma_format函数将千位分隔符逗号插入y轴标签,然后将逗号替换为句点。 这样,可以相对容易地格式化y轴标签。

from pylab import *
import numpy as np
import matplotlib.pyplot as plt
import matplotlib.ticker as ticker

def comma_format(x, p):
    return format(x, "6,.0f").replace(",", ".")

ax = subplot(111)
xx = np.arange(0,20,1)
yy = np.arange(1000,10000,450)
ax.get_yaxis().set_major_formatter(ticker.FuncFormatter(comma_format))
plt.scatter(xx,yy)
plt.show()

enter image description here


网页内容由stack overflow 提供, 点击上面的
可以查看英文原文,
原文链接