使用Python计算累积密度函数的导数

9

累积分布函数的精确导数是否就是概率密度函数(PDF)?我正在使用numpy.diff()计算导数,这样做正确吗?请参见下面的代码:

import scipy.stats as s
import matplotlib.pyplot as plt
import numpy as np

wei = s.weibull_min(2, 0, 2) # shape, loc, scale - creates weibull object
sample = wei.rvs(1000)
shape, loc, scale = s.weibull_min.fit(sample, floc=0) 

x = np.linspace(np.min(sample), np.max(sample))

plt.hist(sample, normed=True, fc="none", ec="grey", label="frequency")
plt.plot(x, wei.cdf(x), label="cdf")
plt.plot(x, wei.pdf(x), label="pdf")
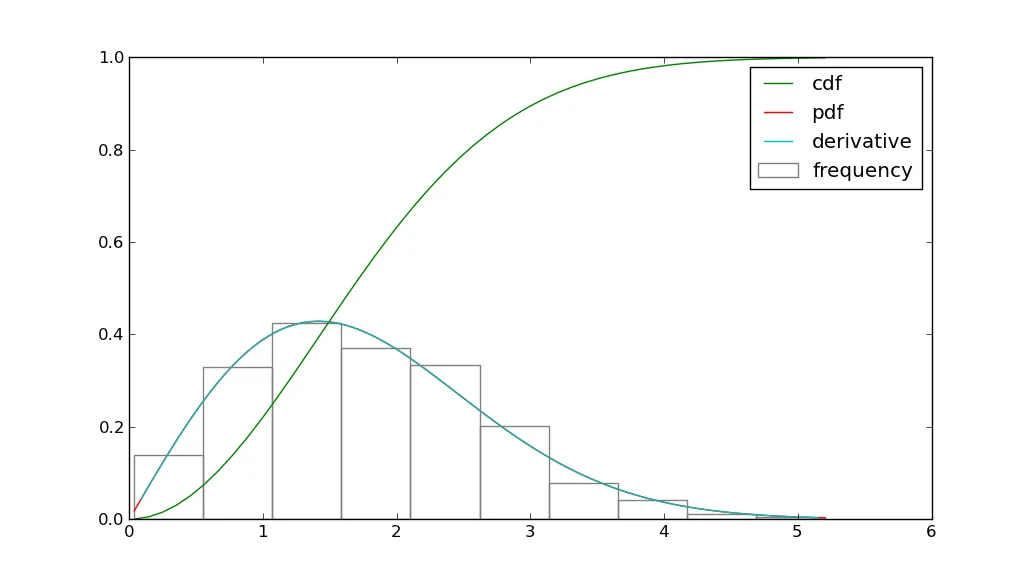
plt.plot(x[1:], np.diff(wei.cdf(x)), label="derivative")
plt.legend(loc=1)
plt.show()

CDF、PDF和导数的比较

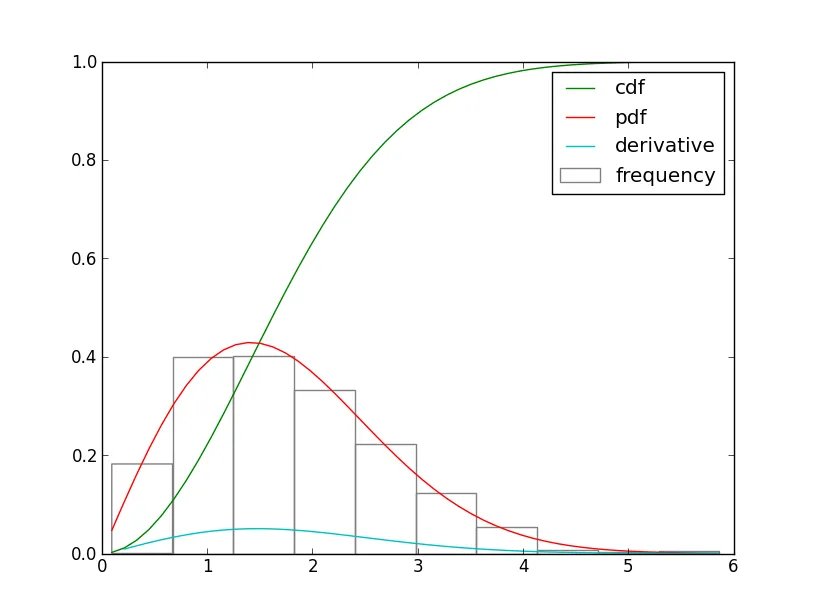
那么,我如何将导数缩放到与PDF等效呢?

1个回答

8

CDF的导数是PDF。

这里是CDF导数的近似值:

dx = x[1]-x[0]
deriv = np.diff(wei.cdf(x))/dx

import scipy.stats as s
import matplotlib.pyplot as plt
import numpy as np

wei = s.weibull_min(2, 0, 2) # shape, loc, scale - creates weibull object
sample = wei.rvs(1000)
shape, loc, scale = s.weibull_min.fit(sample, floc=0) 

x = np.linspace(np.min(sample), np.max(sample))
dx = x[1]-x[0]
deriv = np.diff(wei.cdf(x))/dx
plt.hist(sample, normed=True, fc="none", ec="grey", label="frequency")
plt.plot(x, wei.cdf(x), label="cdf")
plt.plot(x, wei.pdf(x), label="pdf")
plt.plot(x[1:]-dx/2, deriv, label="derivative")
plt.legend(loc=1)
plt.show()

收益率

enter image description here

请注意,与deriv相关的x-locations已经被dx/2移动,因此近似值位于用于计算它的值之间。


网页内容由stack overflow 提供, 点击上面的
可以查看英文原文,
原文链接