向极坐标图中添加第二个轴

11

我尝试在同一张图中绘制两个极坐标图。请参见下面的代码:

fig = super(PlotWindPowerDensity, self).get_figure()
    rect = [0.1, 0.1, 0.8, 0.8]
    ax = WindSpeedDirectionAxes(fig, rect)

    self.values_dict = collections.OrderedDict(sorted(self.values_dict.items()))
    values = self.values_dict.items()
    di, wpd = zip(*values)
    wpd = np.array(wpd).astype(np.double)
    wpdmask = np.isfinite(wpd)
    theta = self.radar_factory(int(len(wpd)))

    # spider plot
    ax.plot(theta[wpdmask], wpd[wpdmask], color = 'b', alpha = 0.5)
    ax.fill(theta[wpdmask], wpd[wpdmask], facecolor = 'b', alpha = 0.5)

    # bar plot
    ax.plot_bar(table=self.table, sectors=self.sectors, speedbins=self.wpdbins, option='wind_power_density', colorfn=get_sequential_colors)

    fig.add_axes(ax)
    return fig

当前结果

条形图的长度代表数据库(该部分的采样点数)。条形的颜色显示了对应部分某些数值区间(例如2.5-5 m/s)的频率(蓝色:低,红色:高)。蓝色蜘蛛图显示了每个部分的平均值。

在所示的图中,每个图的值都很相似,但这很少见。我需要将第二张图分配给另一个轴,并将该轴显示在另一个方向上。

编辑:

在Joe的好回答之后,我得到了图的结果。 暂定结果 这几乎是我想要实现的一切。但有些问题我无法解决。

  1. 此图是为动态更改的数据库制作的。因此我需要一种动态的方式来获得圆圈的相同位置。到目前为止,我解决了这个问题:

    start, end = ax2.get_ylim()
    ax2.yaxis.set_ticks(np.arange(0, end, end / len(ax.yaxis.get_ticklocs())))
    

    意思是:对于第二个坐标轴,我更改刻度以使其适应第一个坐标轴的刻度位置。在大多数情况下,我得到一些小数位,但我不希望这样,因为它会破坏图表的清晰度。有没有更聪明的方法来解决这个问题?

    The ytics(径向刻度)的范围从0到倒数第二个圆圈。如何实现值的范围从第一个圆圈到最后一个(边界)?与第一个轴相同。


请修正您的缩进。看起来您正在使用一组高度定制的类,这使得弄清楚发生了什么变得困难。您能否仅使用标准的matplotlib对象演示您想要的内容? - tacaswell
谢谢您包含这张图片。我自己的声望分数太少了,无法完成。 - fidelitas
1
关于你的第二个问题,如何让最后一个半径标签显示出来,这是因为你正在使用 np.arange 来设置刻度。arange 在终点之前停止(例如,np.arange(0, 0.5, 0.1) 会产生 array([0.0, 0.1, 0.2, 0.3, 0.4]))。如果你想包括终点,请使用 end + dx(其中 dx 是你的间隔)代替。 - Joe Kington
2个回答

12

所以,据我理解,您想在同一个极坐标图上显示具有非常不同数量级的数据。基本上,您正在询问如何在极轴上执行类似于twinx的操作。

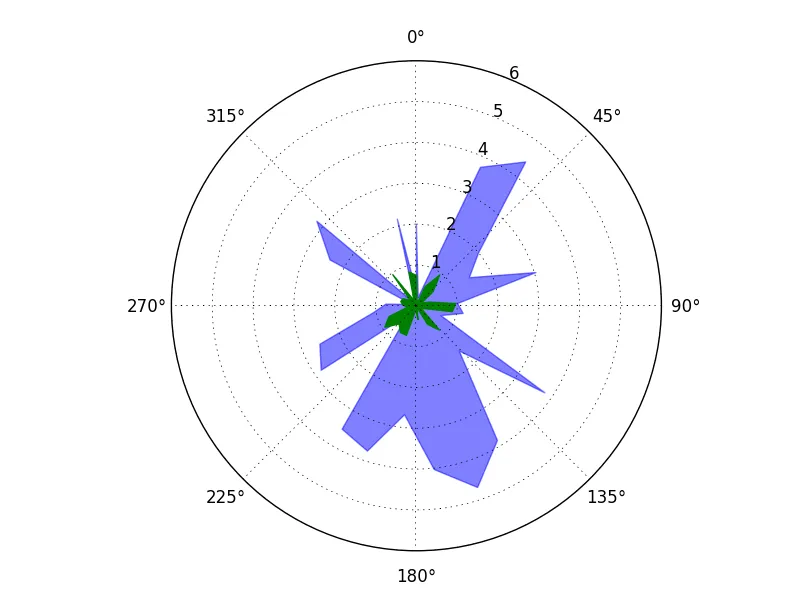
为了说明这个问题,以下示例中的绿色系列与蓝色系列保持在同一个极轴上方便比较的同时,它们的比例尺应该不同。

import numpy as np
import matplotlib.pyplot as plt

numpoints = 30
theta = np.linspace(0, 2*np.pi, numpoints)
r1 = np.random.random(numpoints)
r2 = 5 * np.random.random(numpoints)

params = dict(projection='polar', theta_direction=-1, theta_offset=np.pi/2)
fig, ax = plt.subplots(subplot_kw=params)

ax.fill_between(theta, r2, color='blue', alpha=0.5)
ax.fill_between(theta, r1, color='green', alpha=0.5)

plt.show()

输入图像描述

然而,对于极坐标图,ax.twinx()无法工作。

虽然有办法绕过这个问题,但不是很直观。以下是一个例子:

import numpy as np
import matplotlib.pyplot as plt

def main():
    numpoints = 30
    theta = np.linspace(0, 2*np.pi, numpoints)
    r1 = np.random.random(numpoints)
    r2 = 5 * np.random.random(numpoints)

    params = dict(projection='polar', theta_direction=-1, theta_offset=np.pi/2)
    fig, ax = plt.subplots(subplot_kw=params)
    ax2 = polar_twin(ax)

    ax.fill_between(theta, r2, color='blue', alpha=0.5)
    ax2.fill_between(theta, r1, color='green', alpha=0.5)
    plt.show()

def polar_twin(ax):
    ax2 = ax.figure.add_axes(ax.get_position(), projection='polar', 
                             label='twin', frameon=False,
                             theta_direction=ax.get_theta_direction(),
                             theta_offset=ax.get_theta_offset())
    ax2.xaxis.set_visible(False)
    # There should be a method for this, but there isn't... Pull request?
    ax2._r_label_position._t = (22.5 + 180, 0.0)
    ax2._r_label_position.invalidate()
    # Ensure that original axes tick labels are on top of plots in twinned axes
    for label in ax.get_yticklabels():
        ax.figure.texts.append(label)
    return ax2

main()

输入图像描述

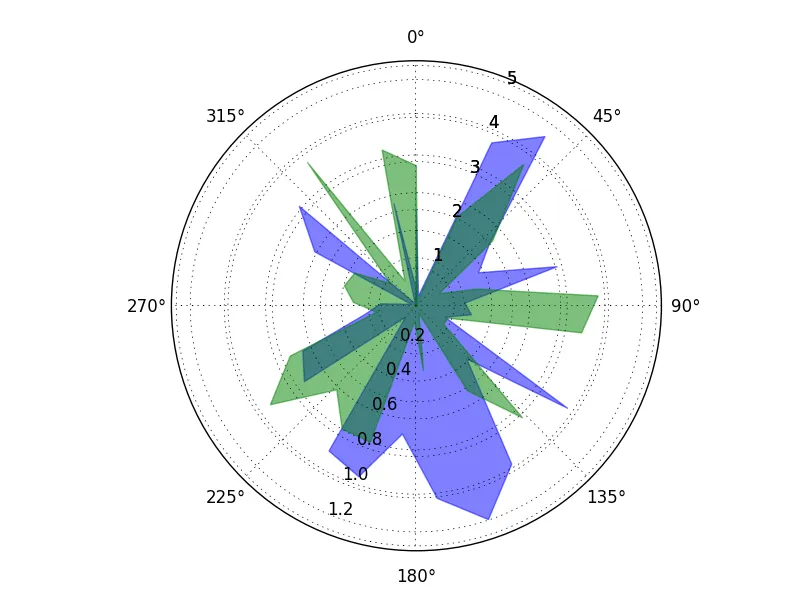
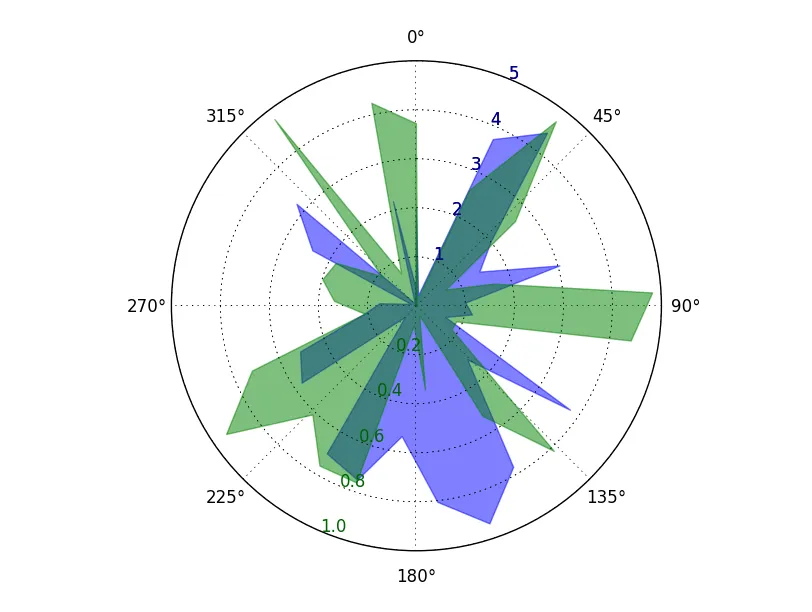
这确实达到了我们想要的效果,但一开始看起来相当糟糕。一个改进的方法是将刻度标签对应到我们所绘制的内容:

plt.setp(ax2.get_yticklabels(), color='darkgreen')
plt.setp(ax.get_yticklabels(), color='darkblue')

在此输入图像描述

然而,我们仍然有双重网格线,这可能会导致困惑。一个简单的方法是手动设置r-limits(和/或r-ticks),以使网格线彼此重叠。或者,您可以编写自定义定位器以自动执行此操作。在这里,让我们坚持简单的方法:

ax.set_rlim([0, 5])
ax2.set_rlim([0, 1])

enter image description here

警告:由于共享轴不适用于极坐标图,上面的实现将在任何改变原始轴位置的情况下出现问题。例如,向图中添加彩条会导致各种问题。尽管有可能解决这个问题,但我并没有包含在内。如果您需要它,请告诉我,我可以添加一个示例。

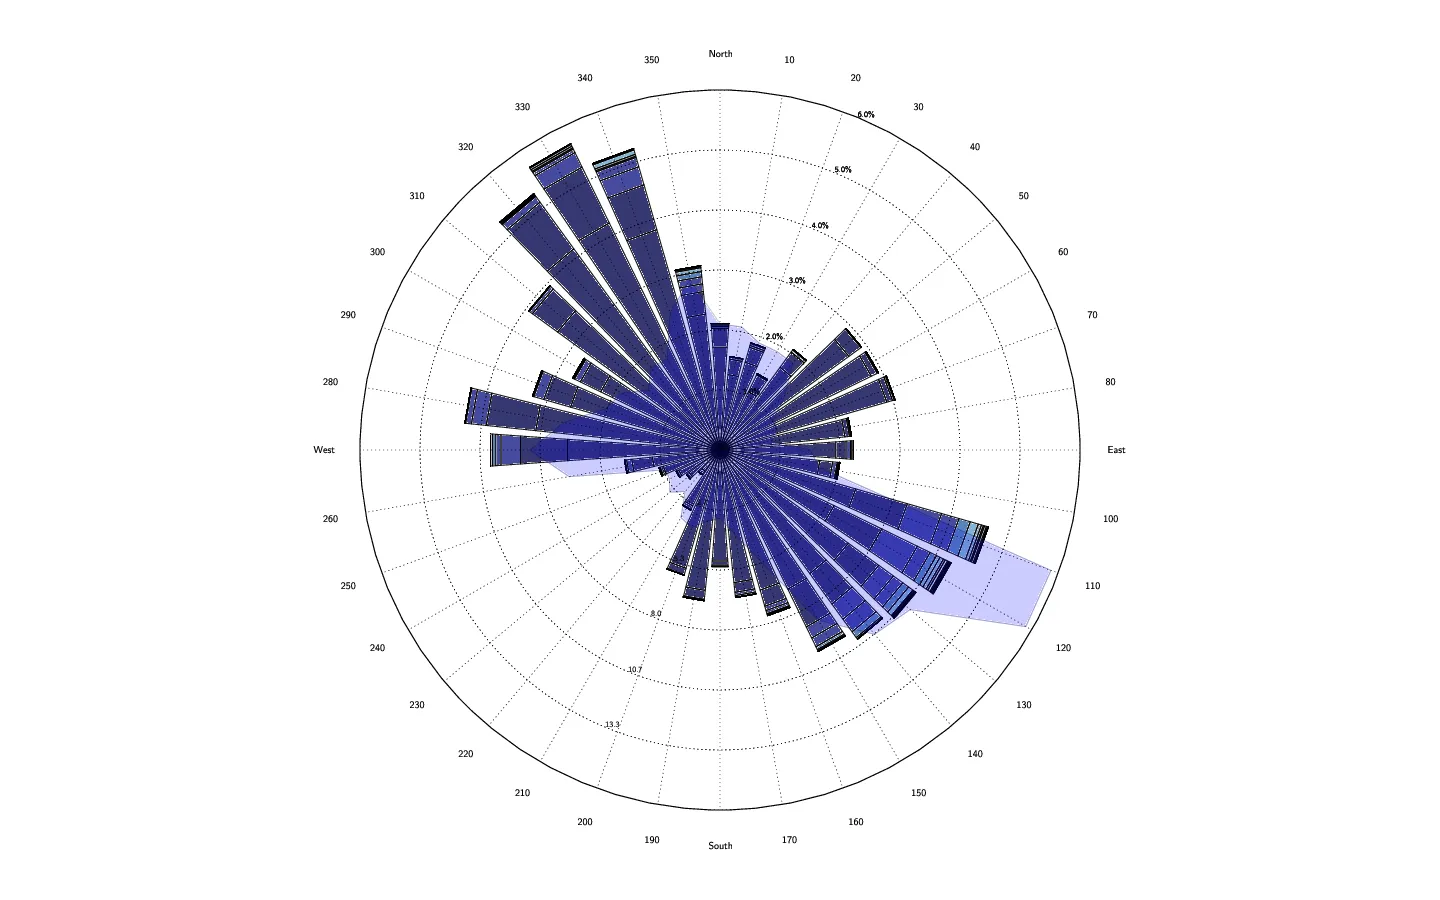
无论如何,以下是完整的、独立的代码来生成最终的图形:

import numpy as np
import matplotlib.pyplot as plt
np.random.seed(1977)

def main():
    numpoints = 30
    theta = np.linspace(0, 2*np.pi, numpoints)
    r1 = np.random.random(numpoints)
    r2 = 5 * np.random.random(numpoints)

    params = dict(projection='polar', theta_direction=-1, theta_offset=np.pi/2)
    fig, ax = plt.subplots(subplot_kw=params)
    ax2 = polar_twin(ax)

    ax.fill_between(theta, r2, color='blue', alpha=0.5)
    ax2.fill_between(theta, r1, color='green', alpha=0.5)

    plt.setp(ax2.get_yticklabels(), color='darkgreen')
    plt.setp(ax.get_yticklabels(), color='darkblue')
    ax.set_ylim([0, 5])
    ax2.set_ylim([0, 1])

    plt.show()

def polar_twin(ax):
    ax2 = ax.figure.add_axes(ax.get_position(), projection='polar', 
                             label='twin', frameon=False,
                             theta_direction=ax.get_theta_direction(),
                             theta_offset=ax.get_theta_offset())
    ax2.xaxis.set_visible(False)

    # There should be a method for this, but there isn't... Pull request?
    ax2._r_label_position._t = (22.5 + 180, 0.0)
    ax2._r_label_position.invalidate()

    # Bit of a hack to ensure that the original axes tick labels are on top of
    # whatever is plotted in the twinned axes. Tick labels will be drawn twice.
    for label in ax.get_yticklabels():
        ax.figure.texts.append(label)

    return ax2

if __name__ == '__main__':
    main()

2
这个回答太好了,我想给它多个赞,但是我不能 :( 我会尽力让自己的回答像这个一样好。 - Games Brainiac
非常感谢您详细且易懂的回答,对我很有帮助。但是,我的第一篇帖子中还提到了一些问题。 - fidelitas
@fidelitas - 谢谢!我会添加一个自动定位器的示例,用于第二个轴刻度,但可能要等到这个周末才能完成。(如果有其他人想尝试一下,随时欢迎!) - Joe Kington
@JoeKington 可能是因为库的新版本,但是这个 hack 对于第二个 y 轴标签的定位对我来说不起作用...它们被绘制在与原始轴相同的方向上,覆盖它们,忽略了 ax2._r_label_position._t 中指定的任何内容。非常感谢您的帮助! - Pato

2

补充一下@JoeKington(很棒的)答案,我发现“确保原始轴刻度标签位于双轴绘制的任何内容之上的技巧”对我不起作用,所以我使用了以下替代方法:

from matplotlib.ticker import MaxNLocator

#Match the tick point locations by setting the same number of ticks in the 
# 2nd axis as the first    
ax2.yaxis.set_major_locator(MaxNLocator(nbins=len(ax1.get_yticks())))

#Set the last tick as the plot limit
ax2.set_ylim(0, ax2.get_yticks()[-1])

#Remove the tick label at zero
ax2.yaxis.get_major_ticks()[0].label1.set_visible(False)

网页内容由stack overflow 提供, 点击上面的
可以查看英文原文,
原文链接