我发现在多图中添加第二个右侧y轴的supylabel似乎不可能。
请问有人能够确认是否可以实现,或者提供如何实现的指导吗?
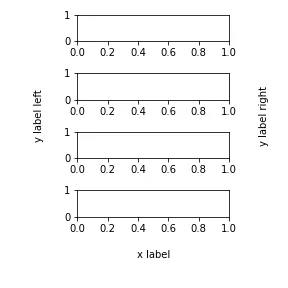
我想要实现这个效果:
由于整个项目中子图的数量是可变的(有时是奇数,有时是偶数),使用subplot级别的标签来标记“中间”子图将会有问题。
我目前是通过图形级别的文本来实现的。在Python中看起来很好,但是保存图像时右侧标签会被截断。我只能通过虚拟ax级别的y标签“\n”来使其正常工作。
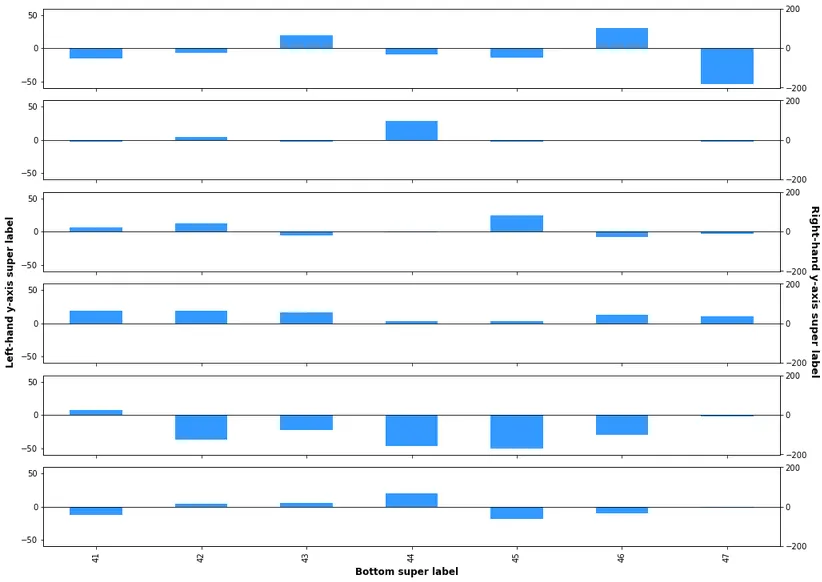
nrows = len(dftmp.GroupingCol.unique())
ncols = 1

fig, ax = plt.subplots(nrows=nrows, ncols=ncols, figsize=(14,10), constrained_layout=True,
                sharex=True)

for e, ep in enumerate(dftmp.GroupingCol.unique(), start=1):

    # define a figure axis and plot data
    ax = plt.subplot(nrows, ncols, e)
    dftmp["ValueCol"].loc[dftmp["GroupingCol"]==ep].plot(ax=ax, kind="bar", color=barcolor_lst) #, use_index=False)

    # horizontal reference line (zero change)
    zero_line = plt.axhline(0, color='k', linewidth=0.8)

    # y-axis extent limits
    ax.set_ylim([50*(-1.1), 50*1.1])

    # create right-hand y-axis
    ax2 = ax.twinx()

    # y-axis extent limits
    ax2.set_ylim([200*(-1), 200])

    # null y-label placeholder to accommodate fig-level pseudo-supylabel
    ax2.set_ylabel(" \n") # requires space and newline to work

# create supylabel for left-axis
supy_left = fig.supylabel("Left-hand y-axis super label", fontweight="bold") #, pad = 7)#, fontdict=fontdict) #fontweight='bold')

# use fig-level text as pseudo-supylable for right-axis
fig.text(x=0.97, y=0.5, s="Right-hand y-axis super label\n\n", size=13, fontweight='bold', rotation=270, ha='center', va='center')

# create super-label for x-axis
supx = fig.supxlabel("Bottom super label", fontweight="bold")
在没有 fig.text 行的情况下,我尝试将第二个 supylabel 命名为不同的对象,代码可以运行,但不会产生标签。
supy_right = fig.supylabel("Cumulative net change (m^3)", fontweight="bold", position=(0.9,0.5))