Ranger中的SHAP重要性

3

如果有一个二元分类问题:如何获取Ranger模型变量的Shap贡献?

样本数据:

library(ranger)
library(tidyverse)

# Binary Dataset
df <- iris
df$Target <- if_else(df$Species == "setosa",1,0)
df$Species <- NULL

# Train Ranger Model
model <- ranger(
  x = df %>%  select(-Target),
  y = df %>%  pull(Target))

我尝试了几个库(DALEX, shapr, fastshap, shapper),但我没有得到任何解决方案。

我希望能像SHAPforxgboost一样获得一些结果:

  • shap.values的输出,即变量的shap贡献
  • shap.plot.summary
2个回答

7

早上好!根据我所找到的信息,您可以按照以下方式使用ranger()fastshap()

library(fastshap)
library(ranger)
library(tidyverse)
data(iris)
# Binary Dataset
df <- iris
df$Target <- if_else(df$Species == "setosa",1,0)
df$Species <- NULL
x <- df %>%  select(-Target)
# Train Ranger Model
model <- ranger(
  x = df %>%  select(-Target),
  y = df %>%  pull(Target))
# Prediction wrapper
pfun <- function(object, newdata) {
  predict(object, data = newdata)$predictions
}

# Compute fast (approximate) Shapley values using 10 Monte Carlo repetitions
system.time({  # estimate run time
  set.seed(5038)
  shap <- fastshap::explain(model, X = x, pred_wrapper = pfun, nsim = 10)
})

# Load required packages
library(ggplot2)
theme_set(theme_bw())

# Aggregate Shapley values
shap_imp <- data.frame(
  Variable = names(shap),
  Importance = apply(shap, MARGIN = 2, FUN = function(x) sum(abs(x)))
)

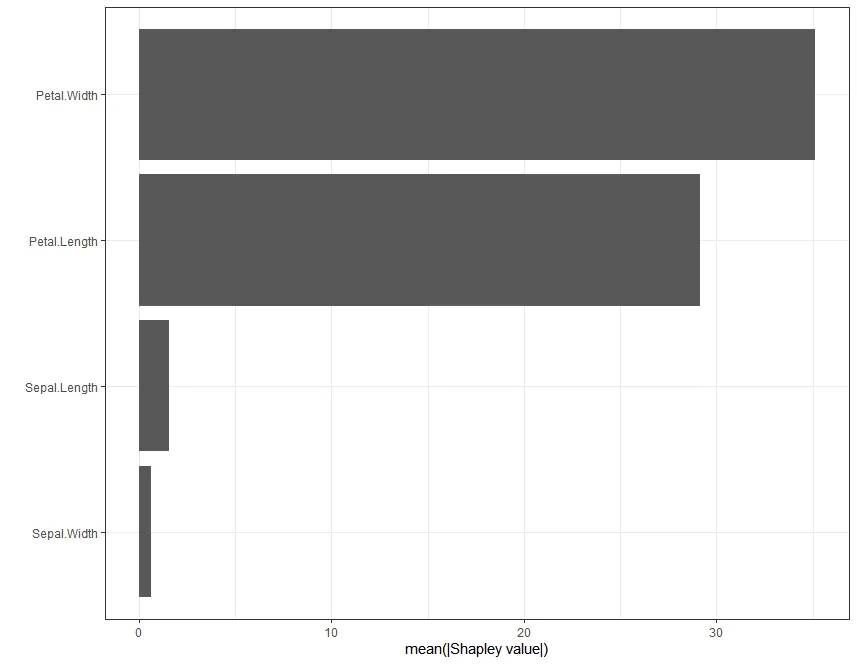
例如,对于变量重要性,您可以进行以下操作:

# Plot Shap-based variable importance
ggplot(shap_imp, aes(reorder(Variable, Importance), Importance)) +
  geom_col() +
  coord_flip() +
  xlab("") +
  ylab("mean(|Shapley value|)")

这里输入图片描述

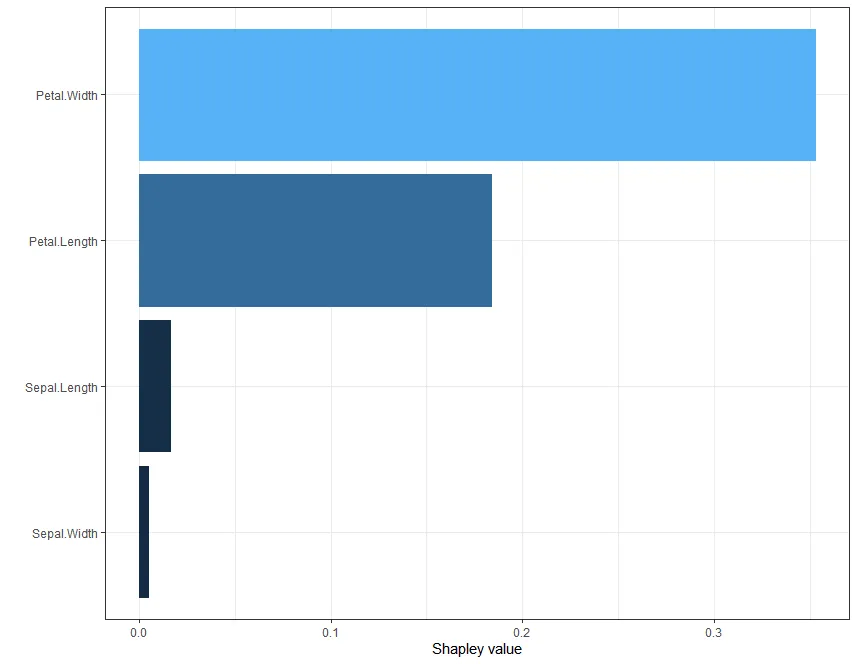
如果你想获得个别预测,可以采用以下方式:

# Plot individual explanations
expl <- fastshap::explain(model, X = x ,pred_wrapper = pfun, nsim = 10, newdata = x[1L, ])
autoplot(expl, type = "contribution")

所有这些信息都可以在这里找到,还有更多的内容:https://bgreenwell.github.io/fastshap/articles/fastshap.html 点击链接查看并解决您的疑惑! :)

输入图像描述


1
我发布了两个R包来执行这些任务:一个是“kernelshap”(数据处理),另一个是“shapviz”(数据可视化)。
library(randomForest)
library(kernelshap)
Ilibrary(shapviz)

set.seed(1)
fit <- randomForest(Sepal.Length ~ ., data = iris,)

# bg_X is usually a small (50-200 rows) subset of the data

# Step 1: Calculate Kernel SHAP values
s <- kernelshap(fit, iris[-1], bg_X = iris)

# Step 2: Turn them into a shapviz object
sv <- shapviz(s)

# Step 3: Gain insights...
sv_importance(sv, show_numbers = TRUE)
sv_dependence(sv, v = "Petal.Length", color_var = "auto")

enter image description here enter image description here


网页内容由stack overflow 提供, 点击上面的
可以查看英文原文,
原文链接