我需要使用ranger函数来绘制变量重要性,因为我有一个大的数据表,并且在我的研究案例中randomForest无法工作。
这是我的代码:
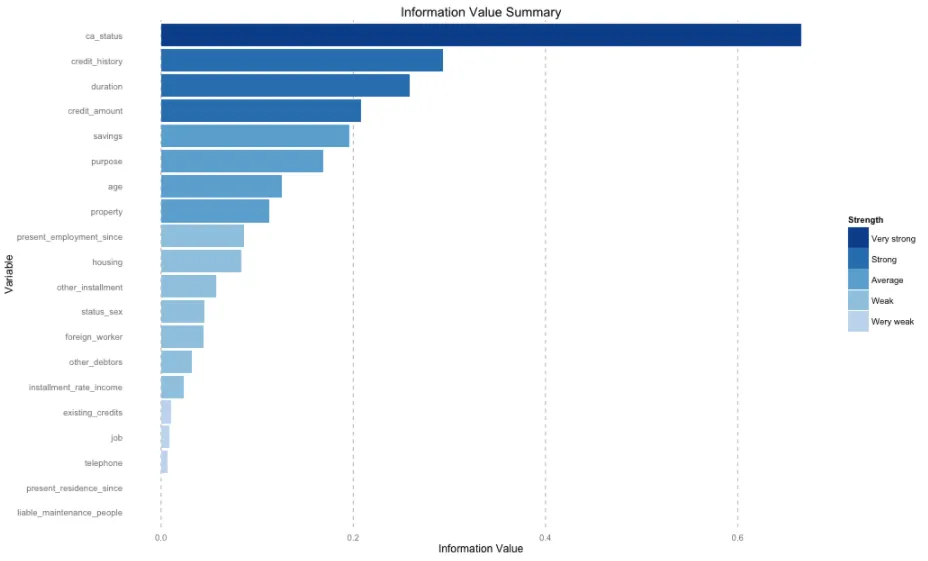
但是根据上面显示的结果,我需要绘制这样一个图形:
但我收到了这个错误:
这是我的代码:
library(ranger)
set.seed(42)
model_rf <- ranger(Sales ~ .,data = data[,-1],importance = "impurity")
然后我创建了一个新的数据框DF,它包含了上面代码中的内容,如下所示
> v<-as.vector(model_rf$variable.importance$Importance)
> w<-(as.vector((row.names(df))))
> DF<-cbind(w,v)
> DF<-as.data.frame(DF)
> DF
                           w                v
1                  DayOfWeek 376393213095.426
2                  Customers 1364058809531.96
3                       Open 634528877741.021
4                      Promo 261749509069.205
5               StateHoliday 5196666310.34041
6              SchoolHoliday  6522969049.3763
7                   DateYear  7035399071.0376
8                  DateMonth 20134820116.2625
9                    DateDay 37631766745.2306
10                  DateWeek 32834962167.9479
11                 StoreType 31568433413.5718
12                Assortment 20257406597.8358
13       CompetitionDistance  111847579772.77
14 CompetitionOpenSinceMonth 46332196019.0118
15  CompetitionOpenSinceYear 45548903472.6485
16                    Promo2                0
17           Promo2SinceWeek 50666744628.7906
18           Promo2SinceYear 40964066303.0407
19           CompetitionOpen 39927447341.0351
20                 PromoOpen  28319356095.063
21            IspromoinSales 2844220121.08598
但是根据上面显示的结果,我需要绘制这样一个图形:
编辑
正如@Sam所建议的,我尝试着调整了这段代码:
> ggplot(DF, aes(x=reorder(w,v), y=v,fill=v))+
+   geom_bar(stat="identity", position="dodge")+ coord_flip()+
+   ylab("Variable Importance")+
+   xlab("")+
+   ggtitle("Information Value Summary")+
+   guides(fill=F)+
+   scale_fill_gradient(low="red", high="blue")
但我收到了这个错误:
请问我该如何解决这个问题呢?谢谢!错误:在连续比例尺中提供了离散值。此外:有42个警告(使用warnings()查看)>
library(ranger)的内容。 - Rprogrammerggplot(stack(model_rf$variable.impotance), aes(ind, values)) + geom_col() + coord_flip()- Axeman