使用xgboost生成的重要性图,包含许多特征。

3
我正在尝试 Kaggle 房价挑战赛:https://www.kaggle.com/c/house-prices-advanced-regression-techniques
这是我编写的脚本:
train    <- read.csv("train.csv")
train$Id <- NULL
previous_na_action = options('na.action')
options(na.action = 'na.pass')
sparse_matrix <- sparse.model.matrix(SalePrice~.-1,data = train)
options(na.action = previous_na_action)
model <- xgboost(data = sparse_matrix, label = train$SalePrice, missing = NA, max.depth = 6, eta = 0.3, nthread = 4, nrounds = 16, verbose = 2, objective = "reg:linear")
importance <- xgb.importance(feature_names = sparse_matrix@Dimnames[[2]], model = model)
print(xgb.plot.importance(importance_matrix = importance))

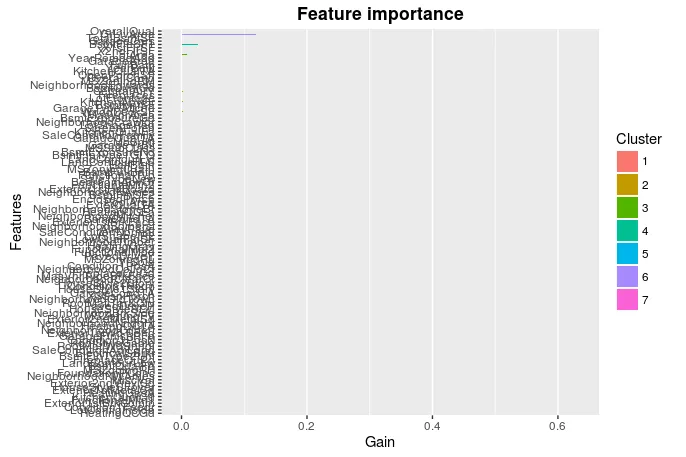
数据有超过70个特征,我使用了xgboost,设置max.depth=6和nrounds=16。

我得到的重要性图表非常混乱,我该如何只查看前5个最重要的特征。

enter image description here

2个回答

4
请查看 xgb.plot.importancetop_n 参数。它可以满足您的需求。
# Plot only top 5 most important variables.
print(xgb.plot.importance(importance_matrix = importance, top_n = 5))

编辑:仅适用于xgboost的开发版本。另一种方法是这样做:

print(xgb.plot.importance(importance_matrix = importance[1:5]))

你使用的是哪个版本?我收到了“未使用参数 top_n = 5”的错误信息。 - Vikash Balasubramanian
看起来他们最近添加了它,CRAN版本上没有。如果你想获取最新版本,在他们的github存储库中安装。我将编辑我的答案提供另一种选择。 - Dex Groves

0
xgbImp1 <- xgb.importance(model = model)

这将识别您的模型的重要特征。

xgbImp1 <- xgbImp1 %>% mutate(rank = dense_rank(desc(Gain)))

这将为每个功能提供一个排名,以便我们可以将其更改为前5、10、15和20个。

ggplot(data=xgbImp1[which(xgbImp1$rank <= 20),], aes(x = reorder(Feature, -Gain), y = Gain)) +
  geom_bar(stat="identity") + 
  theme(axis.text.x = element_text(angle = 90, hjust = 1)) +
  labs(title = "XG Boosted Feature Importance (Top 20)", x = "Features", y = "Information Gain")

网页内容由stack overflow 提供, 点击上面的
可以查看英文原文,
原文链接