XGBoost绘制特征重要性图表没有max_num_features属性。

8

xgboost的绘图API说明:

xgboost.plot_importance(booster, ax=None, height=0.2, xlim=None, ylim=None, title='Feature importance', xlabel='F score', ylabel='Features', importance_type='weight', max_num_features=None, grid=True, **kwargs)

根据拟合的决策树来确定特征重要性。

参数:

booster (Booster, XGBModel or dict) – Booster or XGBModel instance, or dict taken by Booster.get_fscore()
...
max_num_features (int, default None) – Maximum number of top features displayed on plot. If None, all features will be displayed.

在我的实现中,然而运行:
booster_ = XGBClassifier(learning_rate=0.1, max_depth=3, n_estimators=100, 
                      silent=False, objective='binary:logistic', nthread=-1, 
                      gamma=0, min_child_weight=1, max_delta_step=0, subsample=1, 
                      colsample_bytree=1, colsample_bylevel=1, reg_alpha=0,
                      reg_lambda=1, scale_pos_weight=1, base_score=0.5, seed=0)

booster_.fit(X_train, y_train)

from xgboost import plot_importance
plot_importance(booster_, max_num_features=10)

返回:

AttributeError: Unknown property max_num_features
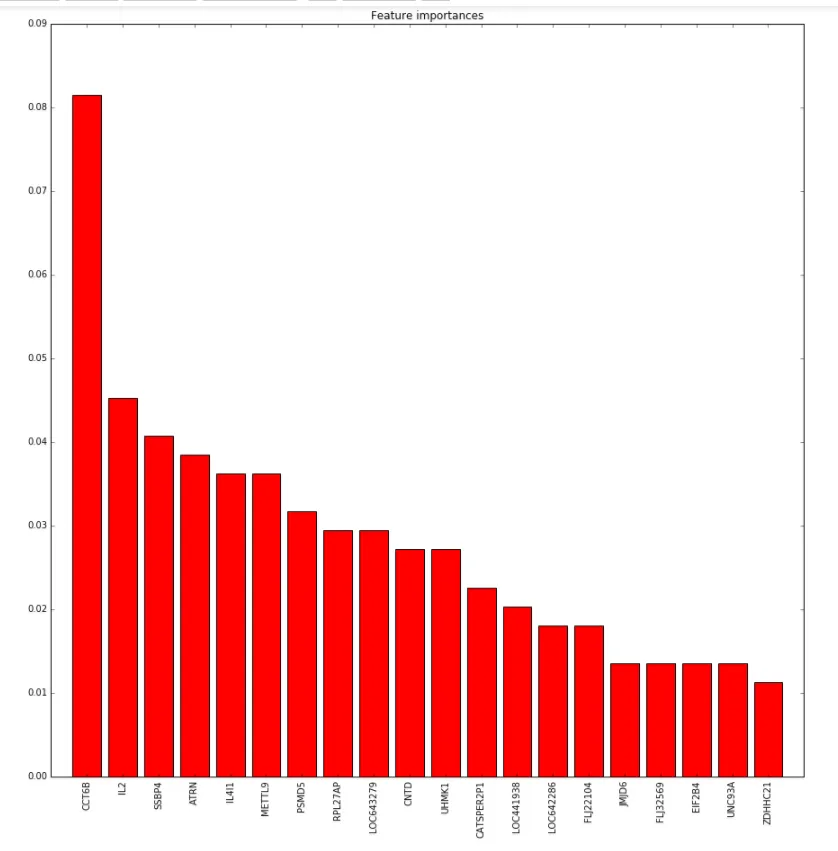
在没有使用参数max_num_features的情况下运行,图形正确显示了整个特征集(在我的情况下是庞大的,约10k个特征)。有什么想法吗?
提前致谢。
详细信息:
> python -V
  Python 2.7.12 :: Anaconda custom (x86_64)

> pip freeze | grep xgboost
  xgboost==0.4a30
4个回答

7

尝试将xgboost库升级到0.6版本,这应该可以解决问题。 要升级该软件包,请尝试以下操作:

$ pip install -U xgboost

如果出现错误,请尝试以下操作:
$ brew install gcc@5
$ pip install -U xgboost

(请参考此https://github.com/dmlc/xgboost/issues/1501


没错!XGboost 的文档可能不是最好的,但是在弄明白之后它还是有效的。我会接受你的回答,因为现在它更相关了(有点忘记我曾经问过这个问题)。 - Carlo Mazzaferro

2

目前为止,我已经(至少部分地)通过这个脚本解决了问题:

def feat_imp(df, model, n_features):

    d = dict(zip(df.columns, model.feature_importances_))
    ss = sorted(d, key=d.get, reverse=True)
    top_names = ss[0:n_features]

    plt.figure(figsize=(15,15))
    plt.title("Feature importances")
    plt.bar(range(n_features), [d[i] for i in top_names], color="r", align="center")
    plt.xlim(-1, n_features)
    plt.xticks(range(n_features), top_names, rotation='vertical')

 feat_imp(filled_train_full, booster_, 20)

enter image description here


使用XGBRegressor时,我遇到了“feature_importances_未找到”的错误。 - xgdgsc
@xgdgsc 你可能需要更新xgboost。feature_importances_显然是他们最新API的一部分。请参阅此帖子以获取更多信息:https://dev59.com/mloT5IYBdhLWcg3wvRlk - Carlo Mazzaferro

2
尽管文档网页的标题是“Python API参考 - xgboost 0.6文档”,但它并不包含xgboost 0.6版本的文档。相反,它似乎包含了最新的git主分支的文档。 xgboost 0.6版本发布于2016年7月29日
This is a stable release of 0.6 version

@tqchen tqchen released this on Jul 29 2016 · 245 commits to master since this release

“添加了 `plot_importance()` 的 `max_num_features` 的提交是在 2017年1月16日 进行的:
作为进一步的检查,让我们检查一下 0.60 版本的 tarball 文件:”
pushd /tmp
curl -SLO https://github.com/dmlc/xgboost/archive/v0.60.tar.gz
tar -xf v0.60.tar.gz 
grep num_features xgboost-0.60/python-package/xgboost/plotting.py
# .. silence.

因此,这似乎是xgboost项目的文档错误。

0

这里只是想补充一点。我仍然遇到了这个错误,我相信其他人也有同样的问题。因此,在这个问题得到解决之前,这里提供另一种实现相同功能的方法:

max = 50
xgboost.plot_importance(dict(sorted(bst.get_fscore().items(), reverse = True, key=lambda x:x[1])[:max]), ax = ax, height = 0.8)

由于您还可以将字典传递给绘图,因此您基本上会获得fscore,以相反的顺序对项目进行排序,选择所需数量的前几个要素,然后转换回字典。

我希望这能帮助其他遇到相同问题的人,尝试仅按其重要性从顶部功能开始绘制一定数量的功能,而不是绘制所有功能。


网页内容由stack overflow 提供, 点击上面的
可以查看英文原文,
原文链接