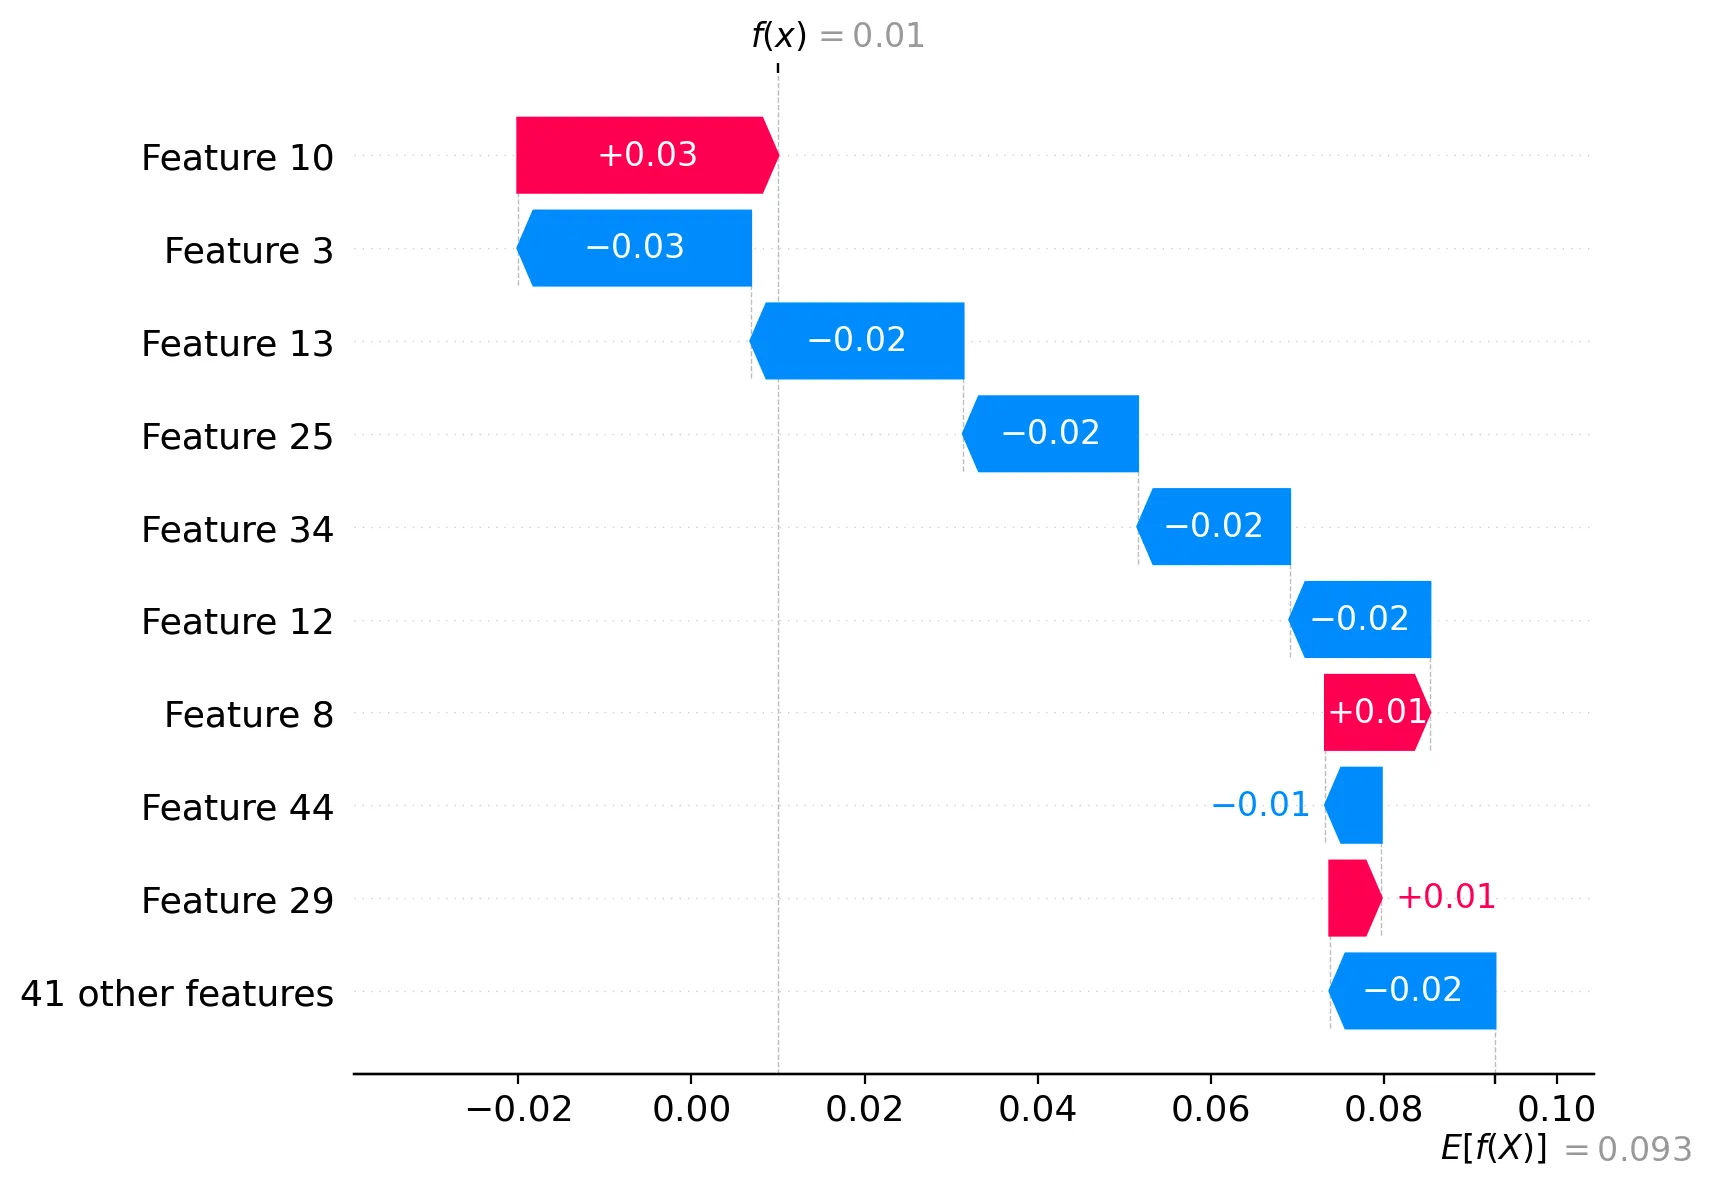
从多类问题的SHAP汇总图中提取每个类别的特征重要性

3
我想知道如何使用shap算法生成特定类别的特征重要性表?

enter image description here

从上面的图中,如何仅提取类别6的特征重要性?
我在这里看到,对于二元分类问题,您可以通过以下方式提取每个类别的shap
# shap values for survival
sv_survive = sv[:,y,:]
# shap values for dying
sv_die = sv[:,~y,:]

如何修改这段代码使其适用于多类问题?
我需要提取与第6类特征重要性相关的shap值。
以下是我的代码开头:
from sklearn.datasets import make_classification
import seaborn as sns
import numpy as np
import pandas as pd
from matplotlib import pyplot as plt
import pickle
import joblib
import warnings
import shap
from sklearn.ensemble import RandomForestClassifier
from sklearn.model_selection import RandomizedSearchCV, GridSearchCV

f, (ax1,ax2) = plt.subplots(nrows=1, ncols=2,figsize=(20,8))
# Generate noisy Data
X_train,y_train = make_classification(n_samples=1000, 
                          n_features=50, 
                          n_informative=9, 
                          n_redundant=0, 
                          n_repeated=0, 
                          n_classes=10, 
                          n_clusters_per_class=1,
                          class_sep=9,
                          flip_y=0.2,
                          #weights=[0.5,0.5], 
                          random_state=17)

X_test,y_test = make_classification(n_samples=500, 
                          n_features=50, 
                          n_informative=9, 
                          n_redundant=0, 
                          n_repeated=0, 
                          n_classes=10, 
                          n_clusters_per_class=1,
                          class_sep=9,
                          flip_y=0.2,
                          #weights=[0.5,0.5], 
                          random_state=17)

model = RandomForestClassifier()

parameter_space = {
    'n_estimators': [10,50,100],
    'criterion': ['gini', 'entropy'],
    'max_depth': np.linspace(10,50,11),
}

clf = GridSearchCV(model, parameter_space, cv = 5, scoring = "accuracy", verbose = True) # model
my_model = clf.fit(X_train,y_train)
print(f'Best Parameters: {clf.best_params_}')

# save the model to disk
filename = f'Testt-RF.sav'
pickle.dump(clf, open(filename, 'wb'))

explainer = Explainer(clf.best_estimator_)
shap_values_tr1 = explainer.shap_values(X_train)
1个回答

3

让我们尝试一个最小可重现的例子:

from sklearn.datasets import make_classification
from shap import Explainer, waterfall_plot, Explanation
from sklearn.ensemble import RandomForestClassifier
from sklearn.model_selection import train_test_split

# Generate noisy Data
X, y = make_classification(n_samples=1000, 
                          n_features=50, 
                          n_informative=9, 
                          n_redundant=0, 
                          n_repeated=0, 
                          n_classes=10, 
                          n_clusters_per_class=1,
                          class_sep=9,
                          flip_y=0.2,
                          random_state=17)
X_train, X_test, y_train, y_test = train_test_split(X, y, random_state=42)

model = RandomForestClassifier()
model.fit(X_train, y_train)

explainer = Explainer(model)
sv = explainer.shap_values(X_test)

我想说的是,您可以通过以下方式实现您的目标:

cls = 9   # class to explain
sv_cls = sv[cls]

为什么?
我们应该能够解释一个数据点:
idx = 99  # datapoint to prove
pred = model.predict_proba(X_test[[idx]])[:, cls]
pred

array([0.01])

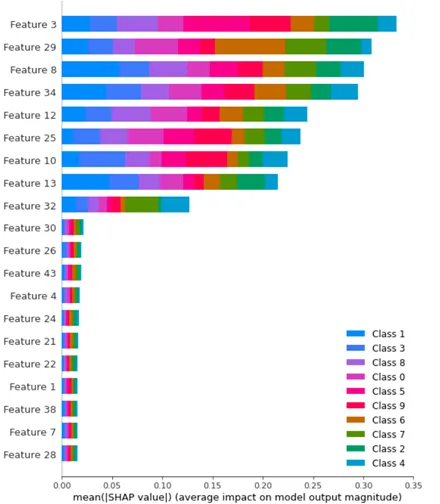
我们可以通过视觉证明我们正在做正确的事情:

waterfall_plot(Explanation(sv_cls[idx], explainer.expected_value[cls]))

在此输入图片描述

而数学上来说:

np.allclose(pred, explainer.expected_value[cls] + sv[cls][idx].sum())

True

感谢您的解释。我非常感激!只是为了确认,您的图片按重要性顺序给出了特征,仅适用于第9类对模型的影响。基本上,这是一个仅显示第9类的摘要图,其中y轴以重要性降序显示?再次感谢! - Joe
1
就图像而言,是的。但请注意,这是我们在idx数据点上进行确认。要查看平均情况下的情况(您的摘要情节),我们需要聚合sv_cls(或多或少为np.abs(sv_cls). mean(0),但您需要检查形状。 - Sergey Bushmanov
再次感谢您的回答。如果我们按照您的建议聚合sv_cls并对聚合后的shap值进行排序,那么我们可以推断出我们现在拥有了该特定类别的特征重要性集合,这种说法正确吗? - Joe
1
没错,但请注意通常你需要聚合绝对值。 - Sergey Bushmanov

网页内容由stack overflow 提供, 点击上面的
可以查看英文原文,
原文链接