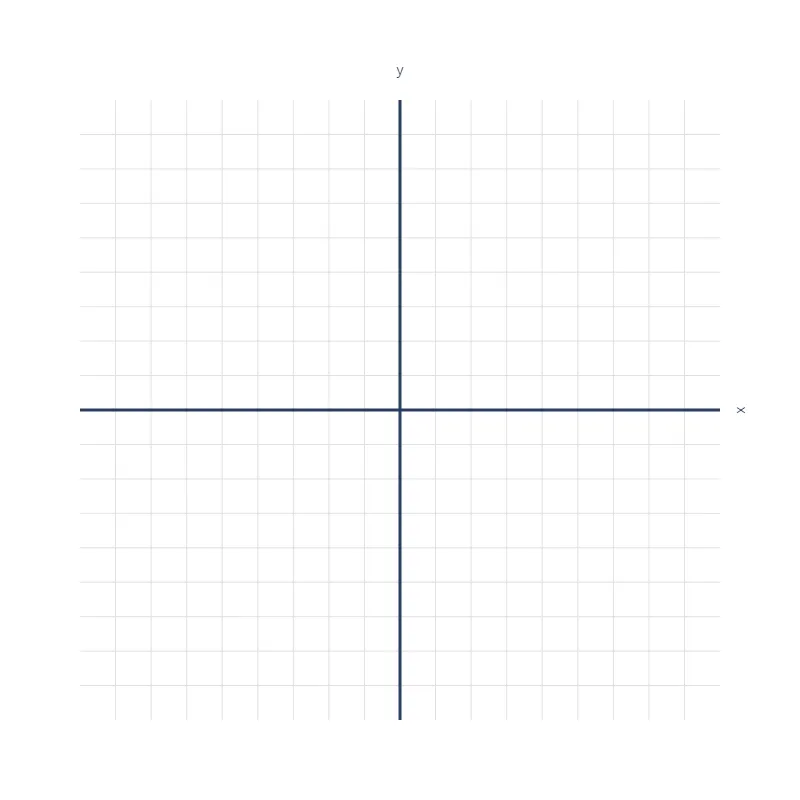
这使用matplotlib创建了我所说的图表:
import matplotlib.pyplot as plt
import numpy as np

xmin, xmax, ymin, ymax = -9, 9, -9, 9
fig, ax = plt.subplots(figsize=(20, 20))

ax.set(xlim=(xmin - 1, xmax + 1), ylim=(ymin - 1, ymax + 1), aspect='equal')

ax.spines['bottom'].set(position="zero", linewidth=2.5)
ax.spines['left'].set(position="zero", linewidth=2.5)
ax.spines['top'].set_visible(False)
ax.spines['right'].set_visible(False)

ax.text(10.15, 0, "x", fontdict=font, va="center")
ax.text(0, 10.15, "y", fontdict=font, ha="center")

x_ticks = np.arange(xmin, xmax)
y_ticks = np.arange(ymin, ymax)

ax.set_xticks(x_ticks[x_ticks != x_ticks])
ax.set_yticks(y_ticks[y_ticks != y_ticks])

ax.set_xticks(np.arange(xmin, xmax+1), minor=True)
ax.set_yticks(np.arange(ymin, ymax+1), minor=True)
ax.grid(which='both', color='grey', linewidth=1, linestyle='-', alpha=0.25)

plt.show()
输出:如下所示的二维笛卡尔平面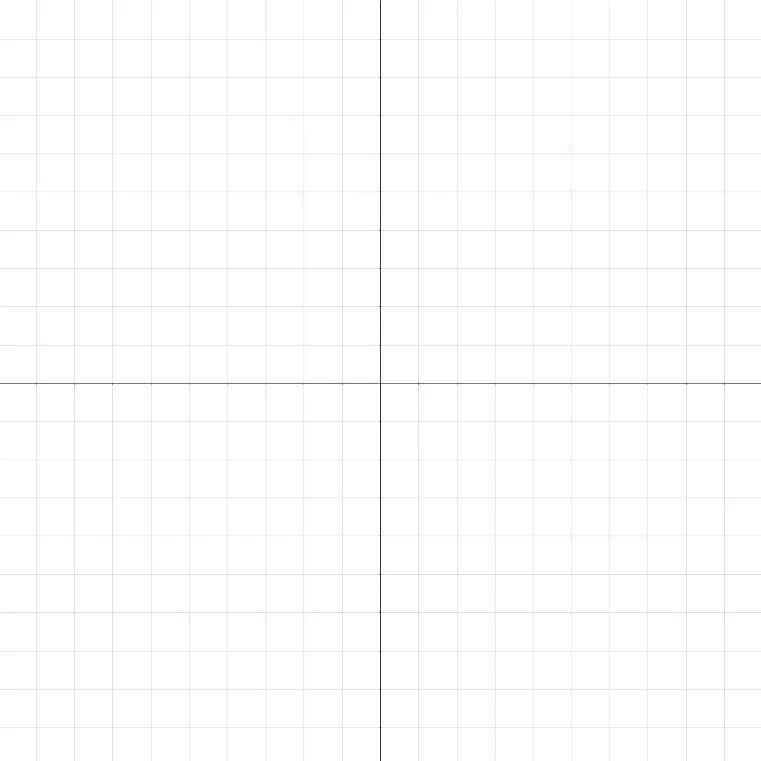
是否可能使用plotly获得类似的结果?