有没有一种方法可以使用matplotlib绘制一个三维笛卡尔坐标系?

6
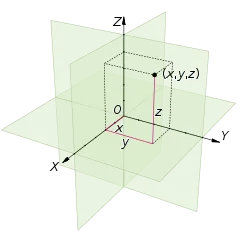
我正在尝试使用matplotlib绘制一个三维笛卡尔坐标系,将原点居中,用箭头表示3个方向,类似于下面的图形。
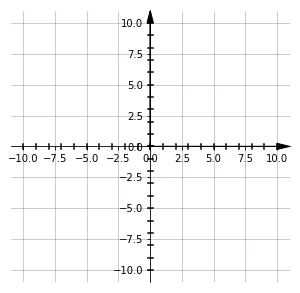
enter image description here

我已经用这段代码绘制了一个2D版本,基于这个帖子

def build_cartesian_plane(max_quadrant_range):
    """ The quadrant range controls the range of the quadrants"""
    l = []
    zeros = []
    f, ax = plt.subplots(figsize=(5,5))
    plt.grid(True, color='grey', zorder=0,alpha=.5)
    head_width = float(0.05) * max_quadrant_range
    head_length = float(0.1) * max_quadrant_range
    ax.arrow(0, 0, max_quadrant_range, 0, head_width=head_width, head_length=head_length, fc='k', ec='k',zorder=100)
    ax.arrow(0, 0, 0, max_quadrant_range, head_width=head_width, head_length=head_length, fc='k', ec='k', zorder=100)
    counter_dash_width = max_quadrant_range * 0.02
    dividers = [0,.1,.2,.3,.4, .5, .6, .7, .8, .9, 1]
    ax.spines['top'].set_color('none')
    ax.spines['bottom'].set_position('zero')
    ax.spines['left'].set_position('zero')
    ax.spines['right'].set_color('none')
    for i in dividers:
        ax.plot([-counter_dash_width, counter_dash_width], [i*max_quadrant_range, i*max_quadrant_range], color='k')
        ax.plot([i * max_quadrant_range, i*max_quadrant_range], [-counter_dash_width, counter_dash_width], color='k')
        ax.plot([-counter_dash_width, counter_dash_width], [-i * max_quadrant_range, -i * max_quadrant_range], color='k')
        ax.plot([-i * max_quadrant_range, -i * max_quadrant_range], [-counter_dash_width, counter_dash_width], color='k')
        l.append(i * max_quadrant_range)
        l.append(-i * max_quadrant_range)
        zeros.append(0)
        zeros.append(0)

build_cartesian_plane(10)
plt.show()

enter image description here

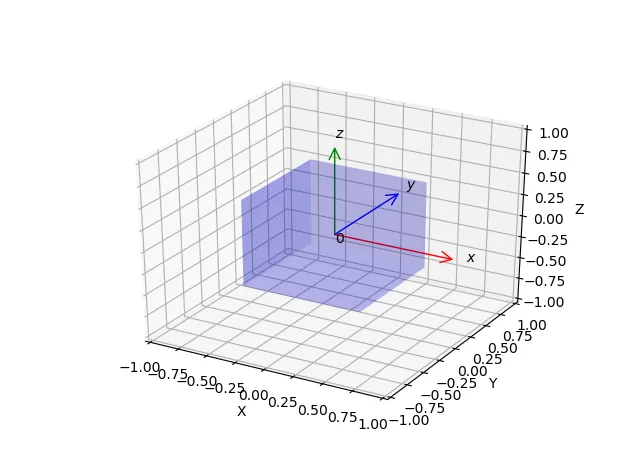
看起来ax.arrow不支持3D,因此我必须使用quiver绘制简单的3D版本。

ax.quiver(0, 0, 0, 0, 3, 0, 
 arrow_length_ratio=0.1)
ax.quiver(0, 0, 0, 3, 0, 0, 
 arrow_length_ratio=0.1)
ax.quiver(0, 0, 0, 0, 0, 3, 
 arrow_length_ratio=0.1)
limt = 2
ax.set_xlim([-limt, limt])
ax.set_ylim([-limt, limt])
ax.set_zlim([-limt, limt])

然后得到了这个

enter image description here

我不熟悉quiver,所以我不确定是否可以使用matplotlib绘制3D笛卡尔坐标系。

任何提示将不胜感激。


3D绘图已经成为Matplotlib的一部分了!请参见https://matplotlib.org/mpl_toolkits/mplot3d/tutorial.html。 - bnaecker
2个回答

11

我找到了两个有用的链接并将它们组合在一起,也许这正是你正在寻找的: 对于箭头: 在mplot3d中绘制右手坐标系 以及对于3D立方体: Python:绘制3D线框立方体 先看一下输出结果: 运行以下代码时的结果

import matplotlib as mpl
from mpl_toolkits.mplot3d import Axes3D
import numpy as np
import matplotlib.pyplot as plt
from matplotlib.patches import FancyArrowPatch
from mpl_toolkits.mplot3d import proj3d


class Arrow3D(FancyArrowPatch):
    def __init__(self, xs, ys, zs, *args, **kwargs):
        FancyArrowPatch.__init__(self, (0, 0), (0, 0), *args, **kwargs)
        self._verts3d = xs, ys, zs

    def draw(self, renderer):
        xs3d, ys3d, zs3d = self._verts3d
        xs, ys, zs = proj3d.proj_transform(xs3d, ys3d, zs3d, renderer.M)
        self.set_positions((xs[0], ys[0]), (xs[1], ys[1]))
        FancyArrowPatch.draw(self, renderer)


def cuboid_data(center, size):
    # suppose axis direction: x: to left; y: to inside; z: to upper
    # get the (left, outside, bottom) point
    o = [a - b / 2 for a, b in zip(center, size)]
    # get the length, width, and height
    l, w, h = size
    x = np.array([[o[0], o[0] + l, o[0] + l, o[0], o[0]],  # x coordinate of points in bottom surface
         [o[0], o[0] + l, o[0] + l, o[0], o[0]],  # x coordinate of points in upper surface
         [o[0], o[0] + l, o[0] + l, o[0], o[0]],  # x coordinate of points in outside surface
         [o[0], o[0] + l, o[0] + l, o[0], o[0]]])  # x coordinate of points in inside surface
    y = np.array([[o[1], o[1], o[1] + w, o[1] + w, o[1]],  # y coordinate of points in bottom surface
         [o[1], o[1], o[1] + w, o[1] + w, o[1]],  # y coordinate of points in upper surface
         [o[1], o[1], o[1], o[1], o[1]],          # y coordinate of points in outside surface
         [o[1] + w, o[1] + w, o[1] + w, o[1] + w, o[1] + w]])    # y coordinate of points in inside surface
    z = np.array([[o[2], o[2], o[2], o[2], o[2]],                        # z coordinate of points in bottom surface
         [o[2] + h, o[2] + h, o[2] + h, o[2] + h, o[2] + h],    # z coordinate of points in upper surface
         [o[2], o[2], o[2] + h, o[2] + h, o[2]],                # z coordinate of points in outside surface
         [o[2], o[2], o[2] + h, o[2] + h, o[2]]])                # z coordinate of points in inside surface
    return x, y, z


if __name__ == '__main__':
    center = [0, 0, 0]
    length = 1
    width = 1
    height = 1
    fig = plt.figure()
    ax1 = fig.add_subplot(111, projection='3d')
    X, Y, Z = cuboid_data(center, (length, width, height))
    ax1.plot_surface(X, Y, Z, color='b', rstride=1, cstride=1, alpha=0.1)
    ax1.set_xlabel('X')
    ax1.set_xlim(-1, 1)
    ax1.set_ylabel('Y')
    ax1.set_ylim(-1, 1)
    ax1.set_zlabel('Z')
    ax1.set_zlim(-1, 1)

    # Here we create the arrows:
    arrow_prop_dict = dict(mutation_scale=20, arrowstyle='->', shrinkA=0, shrinkB=0)

    a = Arrow3D([0, 1], [0, 0], [0, 0], **arrow_prop_dict, color='r')
    ax1.add_artist(a)
    a = Arrow3D([0, 0], [0, 1], [0, 0], **arrow_prop_dict, color='b')
    ax1.add_artist(a)
    a = Arrow3D([0, 0], [0, 0], [0, 1], **arrow_prop_dict, color='g')
    ax1.add_artist(a)

    # Give them a name:
    ax1.text(0.0, 0.0, -0.1, r'$0$')
    ax1.text(1.1, 0, 0, r'$x$')
    ax1.text(0, 1.1, 0, r'$y$')
    ax1.text(0, 0, 1.1, r'$z$')

    plt.show()

希望这有帮助。我还需要漂亮的箭头,如果你找到更好的,请发布;)

0

网页内容由stack overflow 提供, 点击上面的
可以查看英文原文,
原文链接