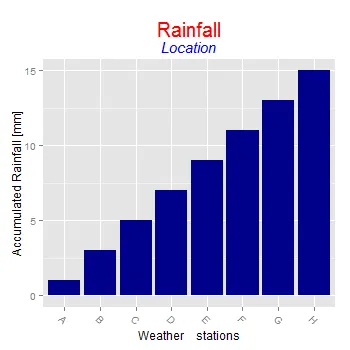
我正在使用ggplot2来改进降水柱状图。
这是一个可重现的例子,展示了我想要实现的效果:
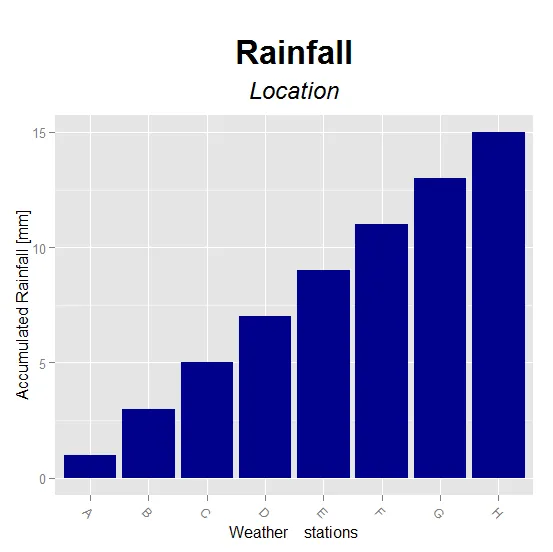
library(ggplot2)
library(gridExtra)
secu <- seq(1, 16, by=2)
melt.d <- data.frame(y=secu, x=LETTERS[1:8])
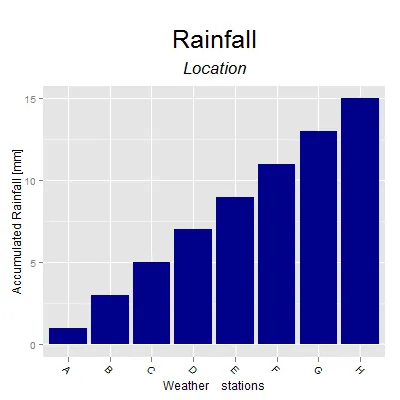
m <- ggplot(melt.d, aes(x=x, y=y)) +
geom_bar(fill="darkblue") +
labs(x="Weather stations", y="Accumulated Rainfall [mm]") +
opts(axis.text.x=theme_text(angle=-45, hjust=0, vjust=1),
title=expression("Rainfall"), plot.margin = unit(c(1.5, 1, 1, 1), "cm"),
plot.title = theme_text(size = 25, face = "bold", colour = "black", vjust = 5))
z <- arrangeGrob(m, sub = textGrob("Location", x = 0, hjust = -3.5, vjust = -33, gp = gpar(fontsize = 18, col = "gray40"))) #Or guessing x and y with just option
z
我不知道如何避免在ggplot2中使用猜测的数字来设置hjust和vjust?有没有更好的方法来添加副标题(不仅仅是使用\n,而是一个具有不同文本颜色和大小的副标题)?
我需要能够使用ggsave生成PDF文件。
以下是两个相关问题:
感谢任何帮助。