我有如下示例:
seed(123)
x<-runif(100)
y<-runif(100)

f <- function(x) { return(4 * x * (1 - x)) }
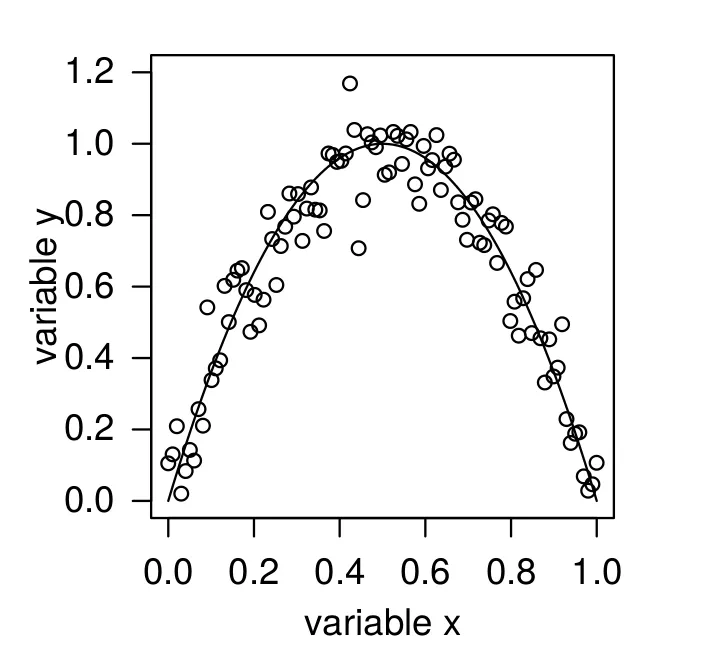
我希望展示一个假设的依赖关系,其中包括函数f和数据点x和y,如下图所示。
有人能使用ggplot2帮忙吗?
谢谢。
我有如下示例:
seed(123)
x<-runif(100)
y<-runif(100)
f <- function(x) { return(4 * x * (1 - x)) }
我希望展示一个假设的依赖关系,其中包括函数f和数据点x和y,如下图所示。
有人能使用ggplot2帮忙吗?
谢谢。
stat_function()。df <- data.frame(x= runif(100), y = runif(100))
f <- function(x) { return(4 * x * (1 - x)) }
ggplot(aes(x,y), data = df) + geom_point() +
stat_function(fun=f)