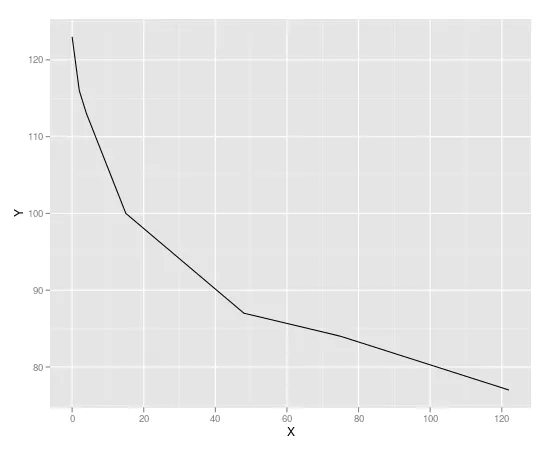
我有一些数据点(x和y),它们之间似乎存在对数关系。
> mydata
    x   y
1   0 123
2   2 116
3   4 113
4  15 100
5  48  87
6  75  84
7 122  77

> qplot(x, y, data=mydata, geom="line")
现在我想找到与图像相适应的基本函数,并允许我推断出其他数据点(例如3或82)。我尝试使用 lm 和 nls,但是没有取得实质性进展。
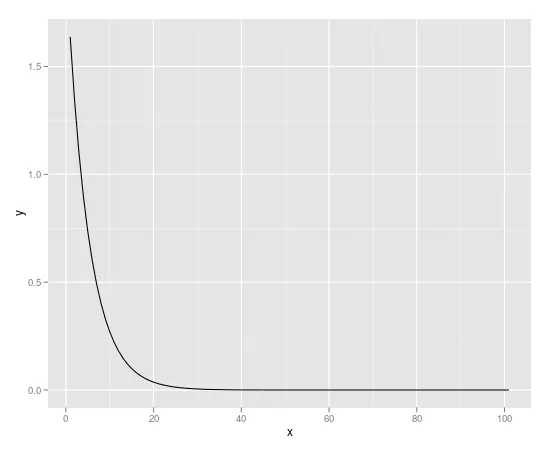
首先,我创建了一个函数,我认为它最像这个图:
f <- function(x, a, b) {
    a * exp(b *-x)
}
x <- seq(0:100)
y <- f(seq(0:100), 1,1)
qplot(x,y, geom="line")
然后,我尝试使用nls生成一个适合的模型:
> fit <- nls(y ~ f(x, a, b), data=mydata, start=list(a=1, b=1))
   Error in numericDeriv(form[[3]], names(ind), env) :
   Missing value or an Infinity produced when evaluating the model
有人能指点我接下来该怎么做吗?
跟进
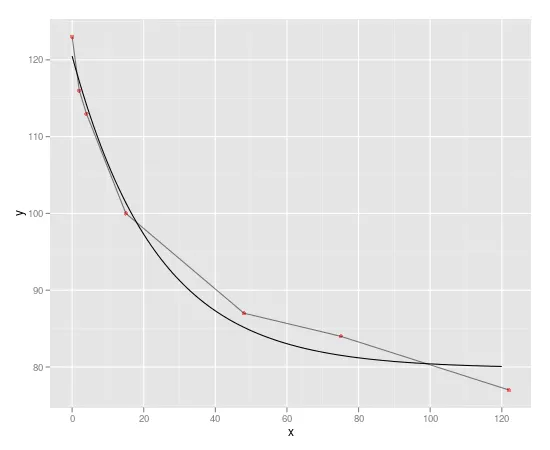
在阅读了您的评论并进行了一些谷歌搜索后,我调整了a、b和c的起始参数,然后突然之间模型收敛了。
fit <- nls(y~f(x,a,b,c), data=data.frame(mydata), start=list(a=1, b=30, c=-0.3))
x <- seq(0,120)
fitted.data <- data.frame(x=x, y=predict(fit, list(x=x))
ggplot(mydata, aes(x, y)) + geom_point(color="red", alpha=.5) + geom_line(alpha=.5) + geom_line(data=fitted.data)
lm方面的努力。 - Spacedmannls的步骤和它产生的错误。 - jnnslm(y ~ poly(x, 3), data = mydata)?可以尝试不同次数的多项式,并使用anova比较lm的结果。 - stevebf(x,a,b,c)。它是什么?您只有f(x,a,b)。 - IVIM