如何避免在Plotly散点图中出现文本重叠?

11

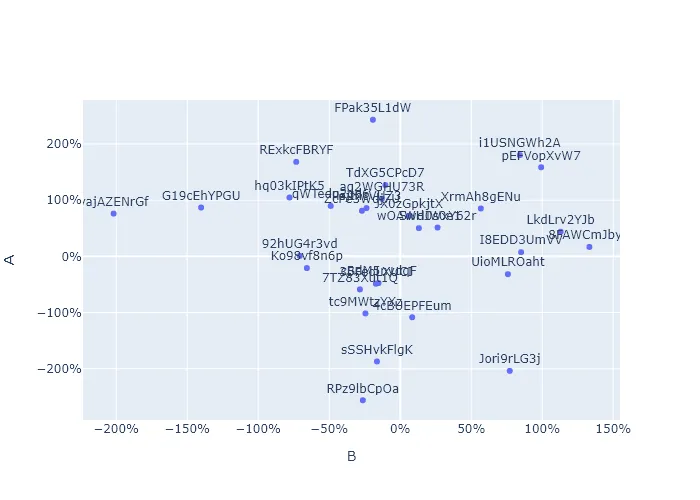
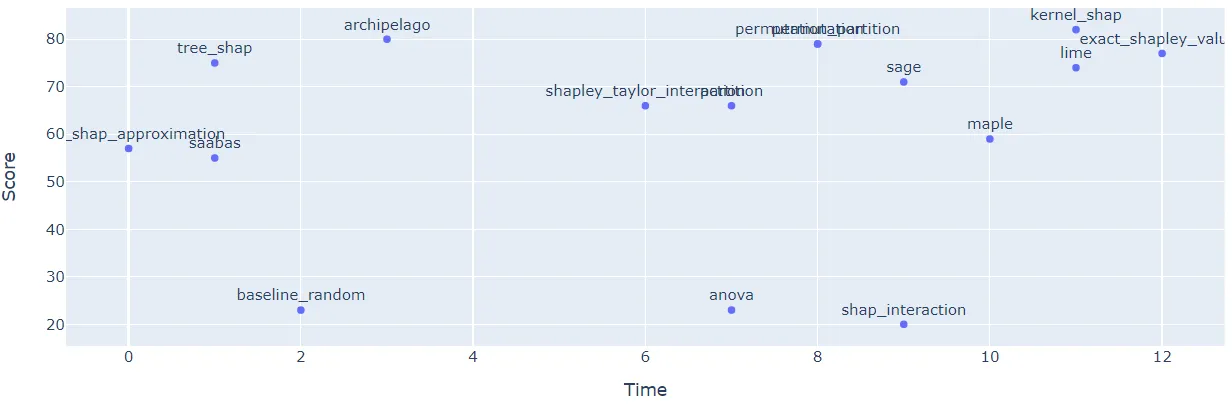
我正在寻找一个解决方案来避免文本标签重叠。我使用plotly scatter创建图像。也许这里有自动化的方法。

from pandas import util
import plotly.express as px
import plotly.graph_objects as go

df = util.testing.makeDataFrame()
df_keyfigures_all = df[['A','B']]


fig = px.scatter(df_keyfigures_all, x="A", y="B",size_max=60,
                     text=df_keyfigures_all.index)

fig.update_traces(textposition='top center')
fig.layout = go.Layout(yaxis=dict(tickformat=".0%"), xaxis=dict(tickformat=".0%"),
                       yaxis_title="A", xaxis_title="B")


fig.update_layout(showlegend=False)
plotly.io.write_image(fig, file='keyfigures.png', format='png')

重叠标签的点

4个回答

10

一种解决方案是交替文本位置,就像这个实时演示中所示:

import pandas as pd
from plotly import express as px, graph_objects as go

df = pd.DataFrame()
df['x'] = [0, 1, 1, 2, 3, 6, 7, 7, 8, 8, 9, 9, 10, 11, 11, 12]
df['y'] = [57, 55, 75, 23, 80, 66, 66, 23, 79, 79, 20, 71, 59, 74, 82, 77]
df['explainer_name'] = ['tree_shap_approximation', 'saabas', 'tree_shap', 'baseline_random', 'archipelago',
                        'shapley_taylor_interaction', 'partition', 'anova', 'permutation_partition', 'permutation',
                        'shap_interaction', 'sage', 'maple', 'lime', 'kernel_shap', 'exact_shapley_values']

fig = px.scatter(df,
                     x='x',
                     y='y',
                     # size='dot_size',
                     text='explainer_name',
                     # log_x=True,
                     labels={
                         "x": "Time",
                         "y": "Score",
                         # 'dot_size': 'Portability',
                         'explainer_name': 'Explainer '
                     },
                     title='No overlapping annotations',  # take some vertical space
                     )
def improve_text_position(x):
    """ it is more efficient if the x values are sorted """
    # fix indentation 
    positions = ['top center', 'bottom center']  # you can add more: left center ...
    return [positions[i % len(positions)] for i in range(len(x))]

fig.update_traces(textposition=improve_text_position(df['x']))
fig.show()

之前: enter image description here

之后: enter image description here


7

很不幸,似乎没有直接的方法来完成这个。在plotly社区论坛上仔细查看会发现它已经被要求,而且开发人员知道这个问题。


2
我也一直在为此苦恼,尤其是对于较长的文本标签和20个左右的点,随机位置并不能很好地解决重叠问题。如果我有20个标签,每个标签有8个可能的位置,那么随机化会得到2^23种组合,其中只有少数几个可能完全没有重叠。
我的解决方法是创建一个带有随机起始位置的图形,并添加一个点击事件来循环单个点的位置。然后我多次生成图形以获得良好的随机起始点,并手动优化仍然存在重叠的点的位置。
import pandas as pd
import plotly.graph_objects as go
from itertools import cycle

df = pd.DataFrame()

df['x'] = [1,2,3]
df['y'] = [1,2,3]

positions = ['top left', 'top center', 'top right', 'middle right', 'bottom right', 'bottom center', 'bottom left', 'middle left']
cycled_list = cycle(positions)

def update_point(trace, points, selector):
    p = list(scatter.textposition)  # get the current location assignments
    for i in points.point_inds:  # all selected point indeces
        p[i] = next(cycled_list)  # replace corresponding list item by new position
        with fig.batch_update():
            scatter.textposition = p
            
def random_text_position(x):
    positions = ['top left', 'top center', 'top right', 'middle left', 'middle right', 'bottom left', 'bottom center', 'bottom right']  # you can add more: left center ...
    return [random.choice(positions) for i in range(len(x))]

fig = go.FigureWidget()

fig.add_trace(go.Scatter(
    x=df['x'],
    y=df['y'],
    mode="markers+text",
    name="Markers and Text",
    text=df.index,
    textposition=random_text_position(df.index)
))

scatter = fig.data[0]

scatter.on_click(update_point)

fig

0

这不是完美的解决方案,但一种方法是将文本隐藏在悬停文本中。

fig = px.scatter(df_keyfigures_all, x="A", y="B",size_max=60,
                 hover_name = df_keyfigures_all.index)

1
谢谢,但我必须在PDF中使用该图像。 - Alex

网页内容由stack overflow 提供, 点击上面的
可以查看英文原文,
原文链接