我正在使用条形图和散点图。必须将值显示为文本,而不是使用悬停文本。在阅读文档时没有找到答案。也许你能帮助我!
如果我能找到一种将条形的文本设置在条形底部的方法,那就太好了。
请查看我的代码和绘图,非常感谢!
from plotly import graph_objs as go
from plotly.subplots import make_subplots
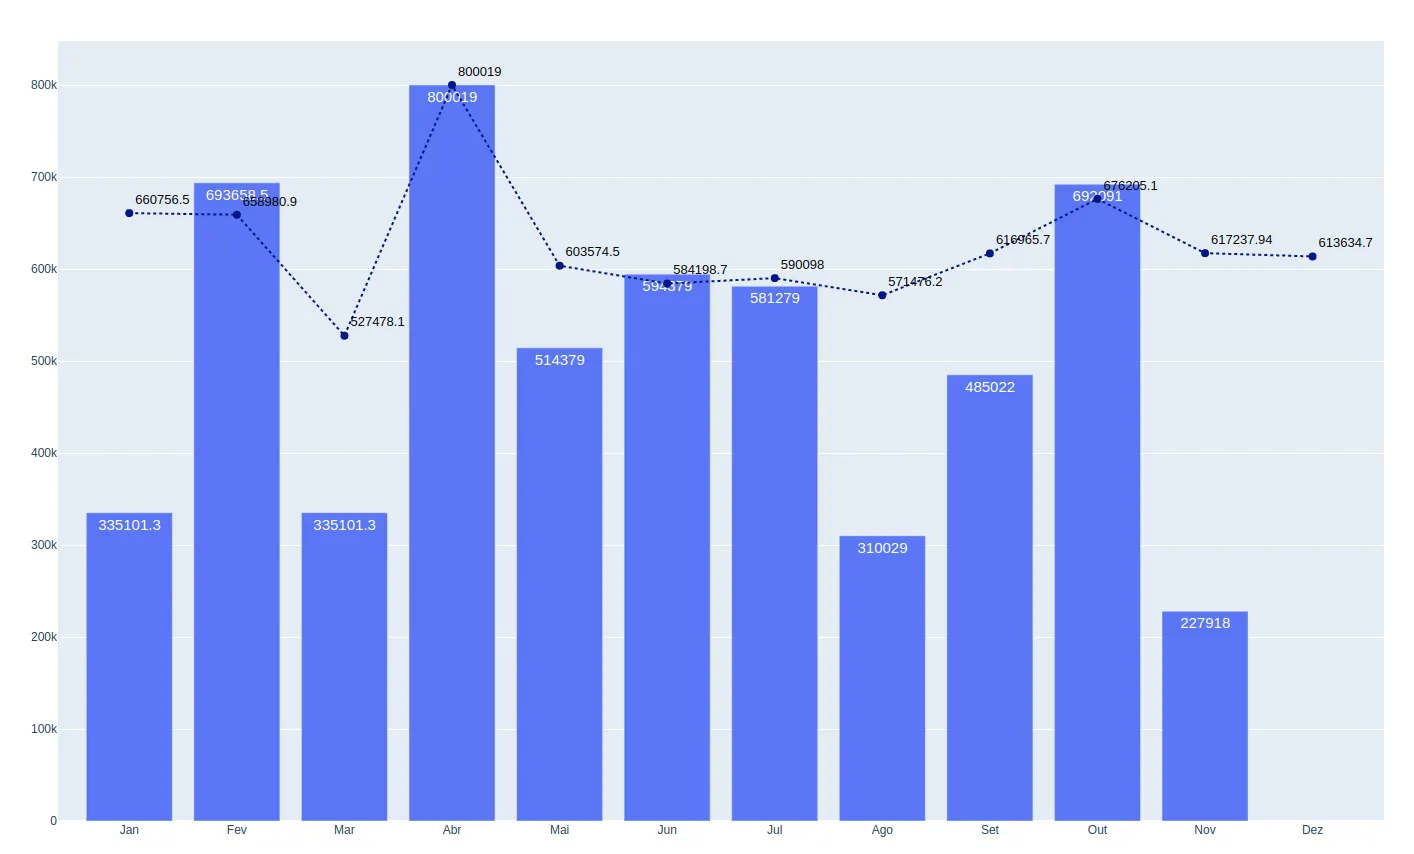
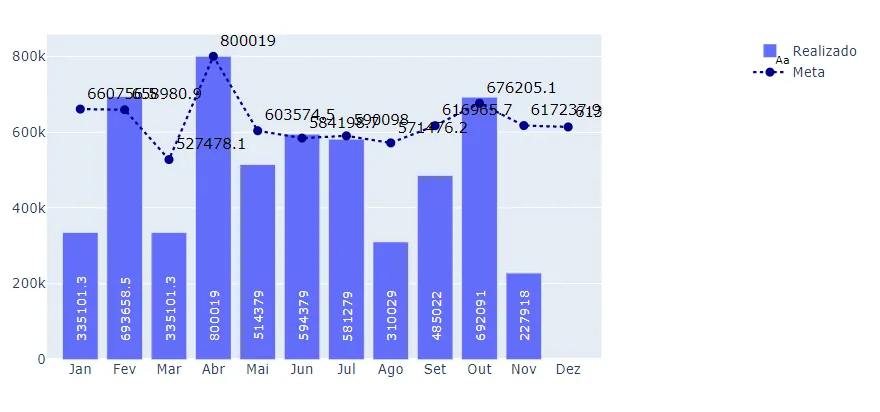
meses = ['Jan', 'Fev', 'Mar', 'Abr', 'Mai', 'Jun', 'Jul', 'Ago', 'Set', 'Out', 'Nov', 'Dez']
rlzd = [335101.3, 693658.5, 335101.3, 800019, 514379, 594379, 581279, 310029, 485022, 692091, 227918]
meta = [660756.5, 658980.9, 527478.1, 800019, 603574.5, 584198.7, 590098, 571476.2, 616965.7, 676205.1, 617237.94, 613634.7]
fig = make_subplots(rows=1, cols=2, column_widths=[0.85, 0.15], print_grid=True, horizontal_spacing=0.05)
fig.add_trace(go.Bar(
x=meses,y = rlzd,
text=rlzd,
textfont=dict(size=15,color='white'),
textposition='auto',
name = 'Realizado',
showlegend=True),
row=1, col=1)
fig.add_trace(go.Scatter(
x=meses,y=meta,
name='Meta',
mode='markers+lines+text',
text=meta,
textfont=dict(size=13,color='black'),
textposition="top right",
marker_size=8,
showlegend=True,
line = go.scatter.Line(color="DarkBlue", dash='dot')),
row=1, col=1)
fig.show()