有没有一种函数可以在散点图中避免重叠的数据标签?
我查看了各种关于textxy、direct.label和geom_text()的问题/回答,但都不成功。也许这是不可能的。
这里是相关数据的样本:
structure(list(cowc = structure(c(5L, 7L, 24L, 24L, 23L, 36L,
34L, 38L, 23L, 6L, 8L, 38L, 38L, 23L, 5L, 7L, 24L, 24L, 23L,
36L, 34L, 38L, 23L, 6L, 8L, 38L, 38L, 23L), .Label = c("AFG",
"ANG", "AZE", "BNG", "BOS", "BUI", "CAM", "CDI", "CHA", "COL",
"CRO", "DOM", "DRC", "ETH", "GNB", "GRG", "GUA", "IND", "INS",
"IRQ", "KEN", "LAO", "LBR", "LEB", "MAL", "MLD", "MZM", "NEP",
"NIC", "PHI", "PNG", "RUS", "RWA", "SAF", "SAL", "SIE", "SOM",
"SUD", "TAJ", "UKG", "YAR", "ZIM"), class = "factor"), conflict = c("Bosnia 92-95",
"Cambodia 70-91", "Lebanon 58-58", "Lebanon 75-89", "Liberia 89-93",
"SieLeo 91-96", "Stafrica 83-91", "Sudan 63-72", "Liberia 94-96",
"Burundi 1993-2005", "Cote d'Ivoire 2002-2007", "Darfur, Sudan 2003-2010",
"Sudan 83-05", "Liberia 1999-2003", "Bosnia 92-95", "Cambodia 70-91",
"Lebanon 58-58", "Lebanon 75-89", "Liberia 89-93", "SieLeo 91-96",
"Stafrica 83-91", "Sudan 63-72", "Liberia 94-96", "Burundi 1993-2005",
"Cote d'Ivoire 2002-2007", "Darfur, Sudan 2003-2010", "Sudan 83-05",
"Liberia 1999-2003"), totalps = c(3L, 2L, 2L, 2L, 1L, 3L, 4L,
3L, 1L, 3L, 3L, 4L, 3L, 3L, 3L, 2L, 2L, 2L, 1L, 3L, 4L, 3L, 1L,
3L, 3L, 4L, 3L, 3L), vetotype = structure(c(1L, 1L, 1L, 1L, 1L,
1L, 1L, 1L, 1L, 1L, 1L, 1L, 1L, 1L, 2L, 2L, 2L, 2L, 2L, 2L, 2L,
2L, 2L, 2L, 2L, 2L, 2L, 2L), .Label = c("strictvetos", "lenientvetos"
), class = "factor"), intensity = c(3L, 4L, 2L, 5L, 2L, 2L, 2L,
2L, 2L, 3L, 2L, 2L, 2L, 2L, 3L, 4L, 2L, 6L, 2L, 2L, 4L, 2L, 2L,
3L, 3L, 2L, 2L, 2L)), .Names = c("cowc", "conflict", "totalps",
"vetotype", "intensity"), class = "data.frame", row.names = c(NA,
-28L))
这是我的代码:
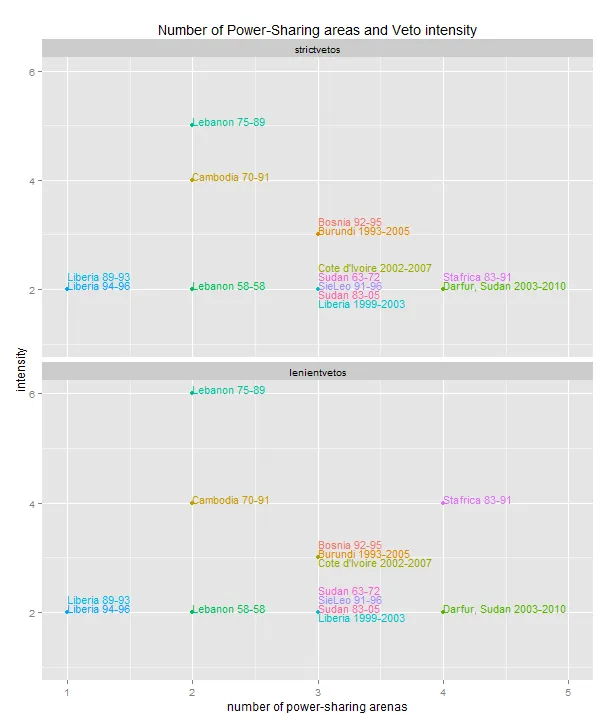
vetotype.plot <- ggplot(vetotype.x, aes(x=totalps, y=intensity, color=conflict))+
      geom_point() +
      labs(x="number of power-sharing arenas", y="intensity") +
      ggtitle("Number of Power-Sharing areas and Veto intensity") +
      geom_text(aes(label=conflict),hjust=0, vjust=0, size=4)+
      scale_x_continuous(limits=c(1, 5))+
      theme(legend.position="none")+
      facet_wrap(~vetotype, nrow=2)

plot(vetotype.plot)
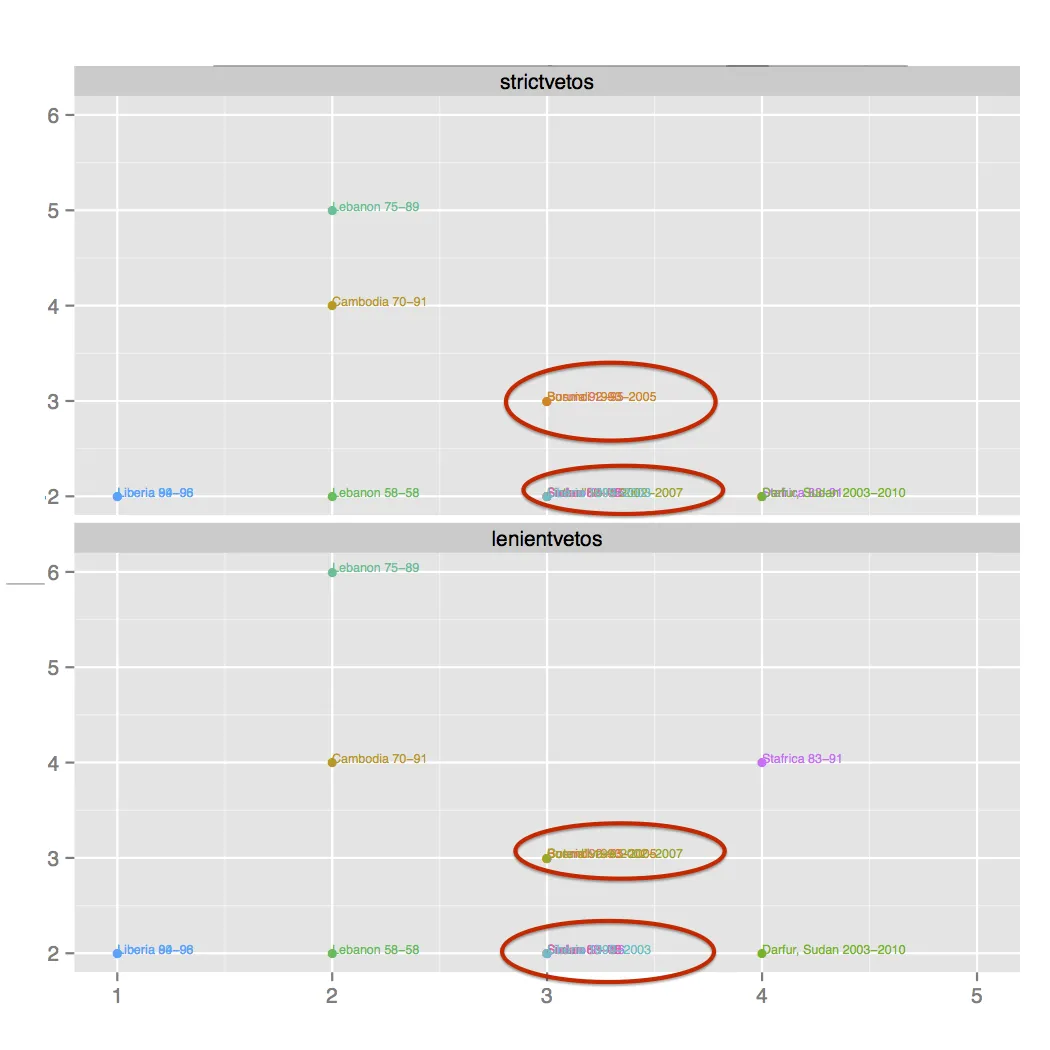
以下是我的图表。我手动突出了那些重叠的数据点。
我正在寻找一种“自动”方式来显示重叠数据点的标签,以便它们不会重叠。是否有此目的的功能?非常感谢!
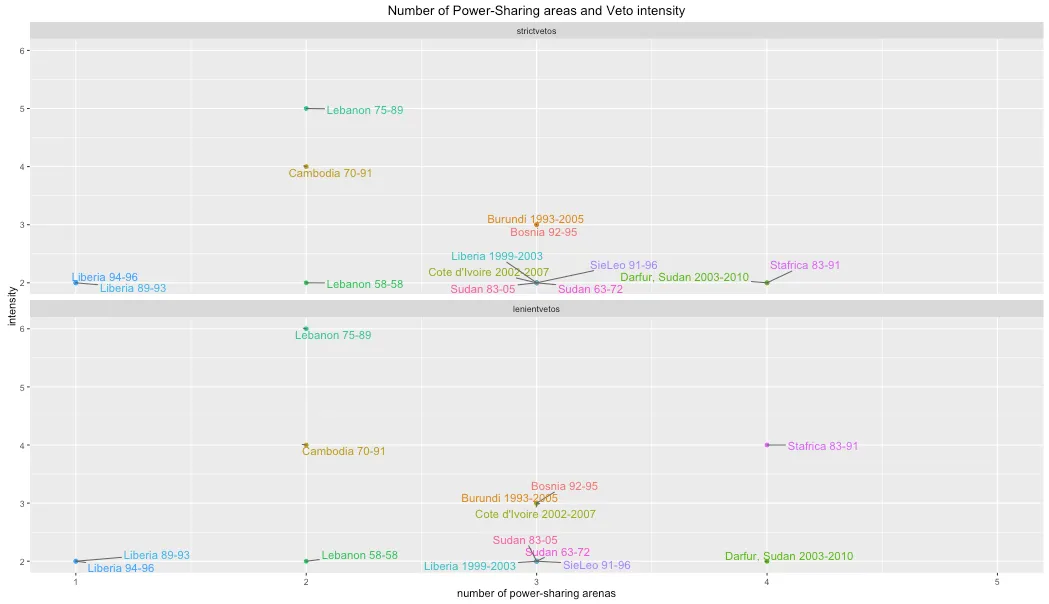
directlabels包和这个相关问题。 - Justin