更新: 我在此处
发布了一个详细的解决方案和讨论(它基于我下面给出的代码)。另外,Hadley非常友好地提供了ggplot2实现的代码。
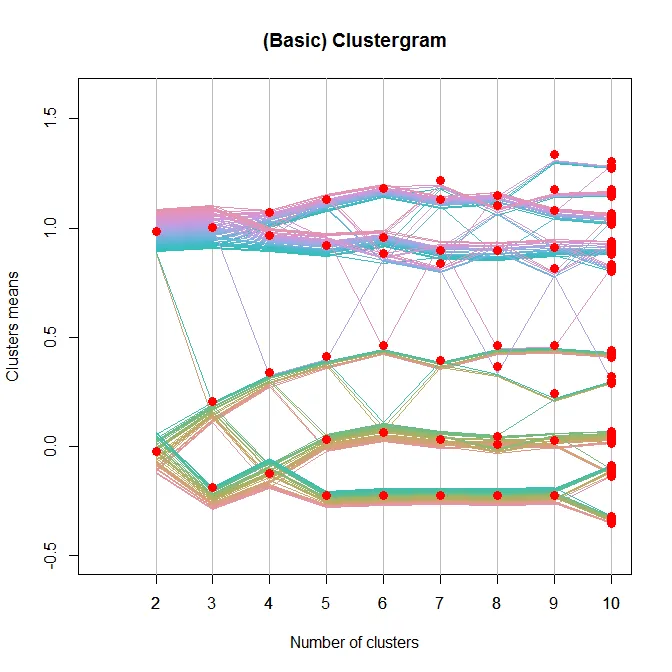
以下是一个基本解决方案(更好的方法请查看上述“更新”):
set.seed(100)
Data <- rbind(matrix(rnorm(100, sd = 0.3), ncol = 2),
matrix(rnorm(100, mean = 1, sd = 0.3), ncol = 2))
colnames(Data) <- c("x", "y")
line.width <- rep(.004, dim(Data)[1])
Y <- NULL
X <- NULL
k.range <- 2:10
plot(0, 0, col = "white", xlim = c(1,10), ylim = c(-.5,1.6),
xlab = "Number of clusters", ylab = "Clusters means",
main = "(Basic) Clustergram")
axis(side =1, at = k.range)
abline(v = k.range, col = "grey")
centers.points <- list()
for(k in k.range){
cl <- kmeans(Data, k)
clusters.vec <- cl$cluster
the.centers <- apply(cl$centers,1, mean)
noise <- unlist(tapply(line.width, clusters.vec,
cumsum))[order(seq_along(clusters.vec)[order(clusters.vec)])]
noise <- noise - mean(range(noise))
y <- the.centers[clusters.vec] + noise
Y <- cbind(Y, y)
x <- rep(k, length(y))
X <- cbind(X, x)
centers.points[[k]] <- data.frame(y = the.centers , x = rep(k , k))
}
require(colorspace)
COL <- rainbow_hcl(100)
matlines(t(X), t(Y), pch = 19, col = COL, lty = 1, lwd = 1.5)
lapply(centers.points,
function(xx){ with(xx,points(y~x, pch = 19, col = "red", cex = 1.3)) })
 (来源:schonlau.net)
我不确定这是否真的有用,但为了尝试一下,我想用R来复现它,但不确定如何做。
(来源:schonlau.net)
我不确定这是否真的有用,但为了尝试一下,我想用R来复现它,但不确定如何做。
colnames(x)更改为colnames(data),而循环中的points(y~x)调用未被使用 :)除此之外,它似乎工作得很好。 - nico