在R中创建累积步骤图

8

假设我有这个示例数据框:

set.seed(12345)
n1 <- 3
n2 <- 10
n3 <- 60

times <- seq(0, 100, 0.5)

individual <- c(rep(1, n1), 
                rep(2, n2), 
                rep(3, n3))

events <- c(sort(sample(times, n1)),
            sort(sample(times, n2)),
            sort(sample(times, n3)))

df <- data.frame(individual = individual, events = events)

这给了

> head(df, 10)
   individual events
1           1   72.0
2           1   75.5
3           1   87.5
4           2    3.0
5           2   14.5
6           2   16.5
7           2   32.0
8           2   45.5
9           2   50.0
10          2   70.5

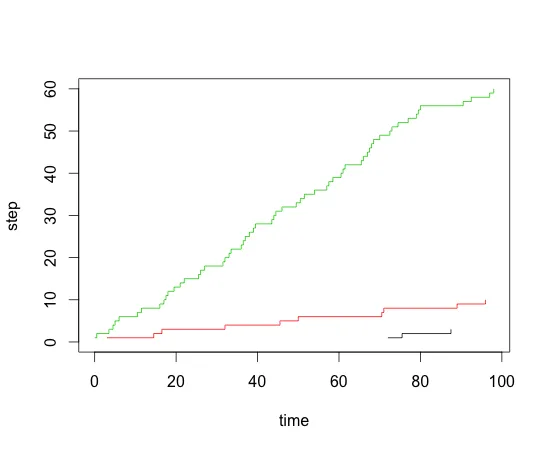
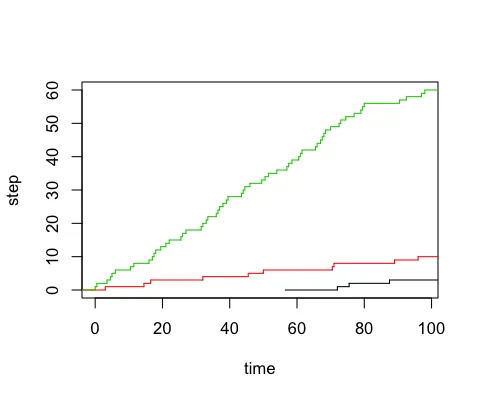
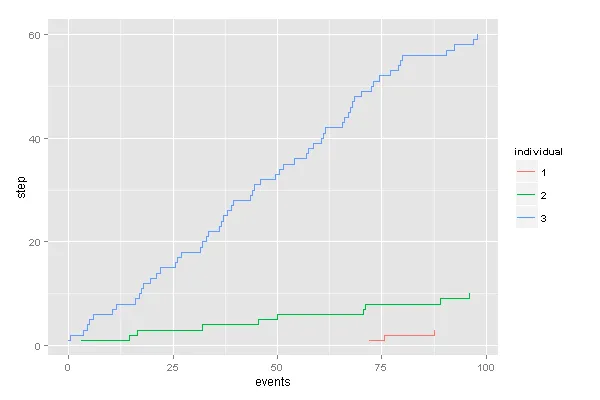
我想绘制一个事件的累积步骤图,以便每个个体都有一条线,每次“遇到”一个事件时,该线就会上升1。
例如,个体1将从0上升到72.0,然后上升到1,直到75.5时变为2,并在87.5上升到3,一直到图表的结尾。
最简单的方法是什么?

这个 df$counter <- ave(df$individual, df$individual, FUN = seq_along) 有帮助吗?不确定你想要什么样的图表,但这应该可以给你“事件计数”。 - vaettchen
@vaettchen:是的,它可以! - nico
3个回答

6
df$step <- 1

library(plyr)
df <- ddply(df,.(individual),transform,step=cumsum(step))

plot(step~events,data=df[df$individual==1,],type="s",xlim=c(0,max(df$events)),ylim=c(0,max(df$step)),xlab="time",ylab="step")
lines(step~events,data=df[df$individual==2,],type="s",col=2)
lines(step~events,data=df[df$individual==3,],type="s",col=3)

step plot


太好了!我喜欢基础图形的答案 :) 如果有一种方法可以从0开始绘制图形就太完美了(我想我可以在开头添加一个0)。我猜我会在unique(df$Individual)上使用apply来进行一次函数调用中的绘图。 - nico
非常感谢。我不知道 type="s" 参数对于 lines 是有效的,它非常方便。 - Pavel Razgovorov

6

在stats包中还有stepfun函数。使用该函数,您可以为该对象类使用plot方法:

sdf <- split(df, individual)

plot(1, 1, type = "n", xlim = c(0, max(events)), ylim = c(0, max(table(individual))),
  ylab = "step", xlab = "time")

sfun <- lapply(sdf, function(x){
    sf <- stepfun(sort(x$events), seq_len(nrow(x) + 1) - 1)
    plot(sf, add = TRUE, col = unique(x$individual), do.points = FALSE)
})

enter image description here


5
使用ggplot2
library(ggplot2)

# Add step height information with sequence and rle
df$step <- sequence(rle(df$individual)$lengths)

# plot
df$individual <- factor(df$individual)
ggplot(df, aes(x=events, group=individual, colour=individual, y=step)) + 
  geom_step()

enter image description here


这正是我在寻找的。在接受这个答案之前,我会等几天看看是否有其他答案(我想看到使用基本图形的答案)。 - nico

网页内容由stack overflow 提供, 点击上面的
可以查看英文原文,
原文链接