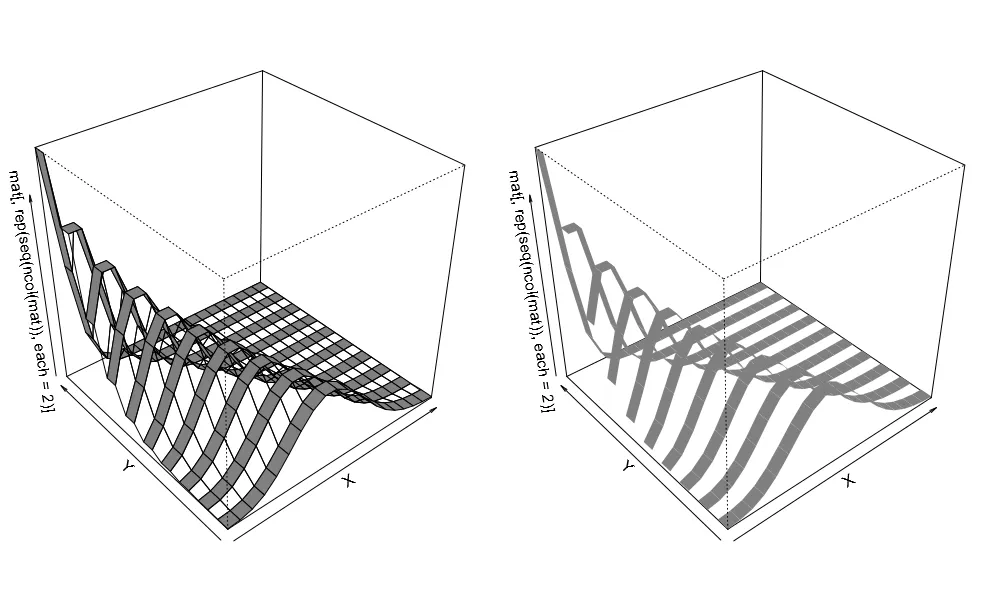
我想创建一个缎带图(实际上是多个类别变量组的线性图),但以3D样式显示。它看起来可能像这样:
因此,我们可能希望将以下示例数据绘制为缎带图:
set.seed(10)
fun <- function(i) data.frame(person=rep(LETTERS[i], 26),
    letter=letters, count=sample(0:100, 26, T))
dat <- do.call(rbind, lapply(1:10, function(i) fun(i)))

library(ggplot2) #a traditional 2-d line plot of the data
ggplot(data=dat, aes(x=letter, y=count, group=person, color=person)) +
    geom_line()
如何在R中实现这一目标?我知道可能有更好的显示数据的方法,但我目前的兴趣在于生成带状样式图。