2个回答
5
您可以尝试:
download.file("https://www.dropbox.com/s/t279m5ojners7fl/NR.tif?dl=1",
              tf <- tempfile(fileext = ".tif"), mode="wb")
library(raster)
library(tiff)
library(ggplot2)
library(reshape2)
DEM <- readTIFF(tf)
plot(as.raster(DEM))
ggplot(melt(DEM),
       aes(value, fill=as.factor(Var3))) +
  geom_histogram(position="dodge")
关于您的更新,有如下建议
r <- as.raster(DEM)
tab <- as.data.frame(sort(table(r)))
ggplot(subset(tab, !r %in% c("#F0F0F0", "#000000")),
              aes(x=r, y=Freq, fill=I(r))) +
         geom_bar(stat="identity") +
  theme(axis.text.x = element_text(angle=90))
- lukeA
3
谢谢,这确实是一个改进。但是直方图已经计算了灰色背景,因此没有代表计算值(即垂直水柱中的硝酸盐梯度)。使用ARCmap创建的直方图具有显着不同的分布(https://www.dropbox.com/s/fcazm1pd84r8tf9/Vertical%20Nitrategradient%20Histogram.jpg?dl=0)。 - Mathias
是的,这是一个经典的RGB直方图,在每个图像处理工具中都可以找到。我认为问题并没有要求地理空间分析。但你应该能够从那里得到你想要的(例如,你可以排除一个灰色背景颜色)。 - lukeA
谢谢。我正在努力变得更具体,我想我需要更加努力。感谢您提供的出色答案。 - Mathias
4
尝试将NA值设置为背景颜色,然后调用hist()函数或使用lukeA的ggplot命令:
library(raster)
ras <- stack("Downloads/NR.tif")
NAvalue(ras) <- 240
hist(ras)
以下是结果图表:
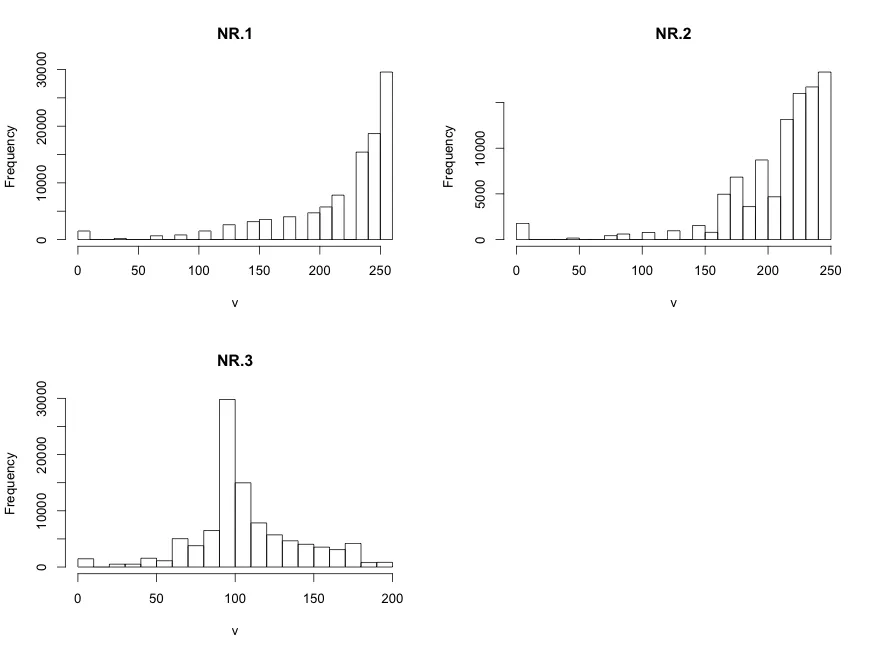
- maRtin
1
另请参阅:
plotRGB(ras) - Robert Hijmans网页内容由stack overflow 提供, 点击上面的可以查看英文原文,
原文链接
原文链接
hist(DEM)或plot(density(DEM))。 - maRtin