更新
这是更好的代码版本,可以更轻松地根据任何数字范围进行分隔:
dat <- data.frame(c1 = c("a", "a", "a", "b", "b", rep("c", 5)), c2=c(11, 14, 23, 12, 21, 17, 14, 29, 22, 25))
groups <- levels(dat$c1)
nranges <- 2
limits <- c(10, 20, 30)
intervals <- sapply(1:nranges, function(i) paste0(limits[i], "-", limits[i+1]))
frequencies <- sapply(1:nranges, function(i) sapply(groups, function(j) sum(dat[dat$c2>limits[i] & dat$c2<limits[i+1],1]==j)))
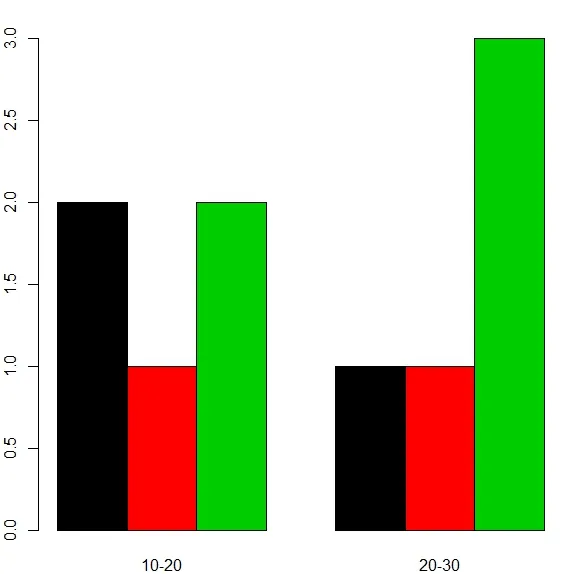
barplot(frequencies, beside = TRUE, col=1:length(groups), names.arg=intervals)
以下是结果,颜色不同并且对于组有适当的标签:
原始内容
这可能对于你的真实数据并不理想,但它适用于你的样本,并将为你提供一个起点:
dat <- data.frame(c1 = c("a", "a", "a", "b", "b", rep("c", 5)), c2=c(11, 14, 23, 12, 21, 17, 14, 29, 22, 25))
groups <- levels(dat$c1)
dat1 <- sapply(groups, function(i) sum(dat[dat$c2>10 & dat$c2<20,1]==i))
dat2 <- sapply(groups, function(i) sum(dat[dat$c2>20 & dat$c2<30,1]==i))
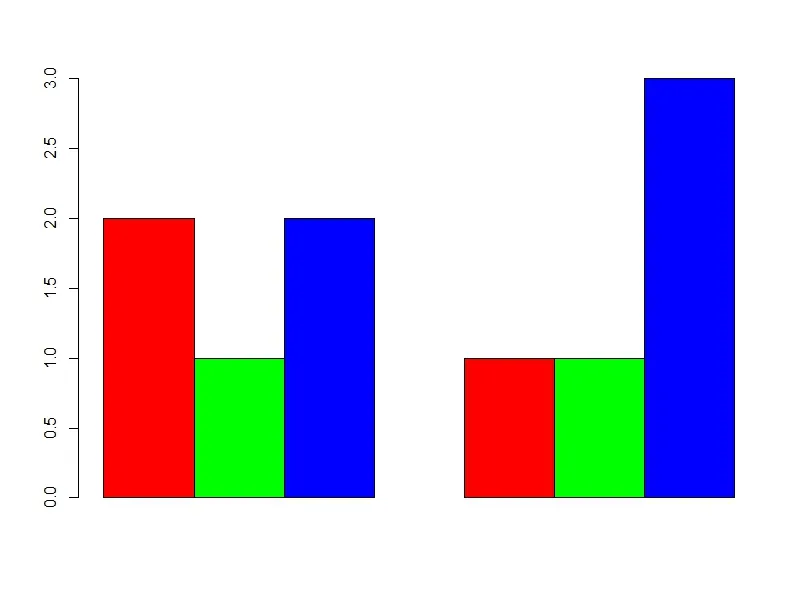
barplot(matrix(c(dat1, dat2), ncol=2), beside = TRUE, col=c("Red", "Green", "Blue"))
这将生成:
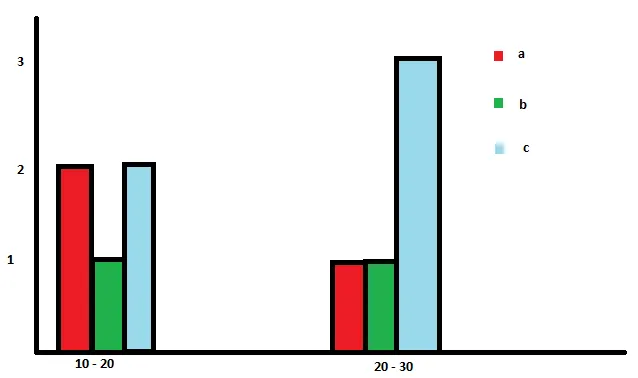
计算频率,然后使用并排堆积的条形图展示数据,而不是尝试使用 hist()。
 看起来我可以使用ggplot做类似的图表,但是我的系统中没有ggplot。是否可能在没有ggplot的情况下生成它?