如何在 seaborn 直方图上添加标准正态分布曲线

4
我想在使用seaborn构建的直方图上添加一个标准正态分布曲线。
import numpy as np
import seaborn as sns 
x = np.random.standard_normal(1000)
sns.distplot(x, kde = False)

非常感谢您提供的帮助!

1个回答

17
  • scipy.stats.norm提供了一个方便的方式来访问具有已知参数的正态分布的概率密度函数;默认情况下,它对应于标准正态分布,mu=0sigma=1
    • 无论数据均值在哪里(例如mu=0mu=10),此答案都适用。
  • python 3.8.11matplotlib 3.4.2seaborn 0.11.2中测试通过
  • 这个问题和答案是针对轴级别图表的;对于图形级别的图表,请参见如何在seaborn displot上绘制正态曲线

导入和数据

import numpy as np                                                              
import seaborn as sns                                                           
from scipy import stats                                                         
import matplotlib.pyplot as plt  

# data
np.random.seed(365)
x = np.random.standard_normal(1000)    

seaborn.histplot

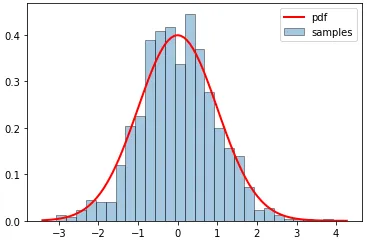
ax = sns.histplot(x, kde=False, stat='density', label='samples')

# calculate the pdf
x0, x1 = ax.get_xlim()  # extract the endpoints for the x-axis
x_pdf = np.linspace(x0, x1, 100)
y_pdf = scipy.stats.norm.pdf(x_pdf)

ax.plot(x_pdf, y_pdf, 'r', lw=2, label='pdf')                                                   
ax.legend()

enter image description here

seaborn.distplot - 已弃用

  • 为了正确对应你的样本数据,直方图应该显示密度而不是计数,因此在 seaborn.distplot 调用中使用 norm_hist=True
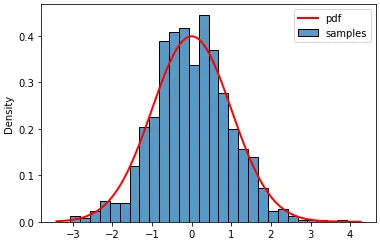
ax = sns.distplot(x, kde = False, norm_hist=True, hist_kws={'ec': 'k'}, label='samples')

# calculate the pdf
x0, x1 = ax.get_xlim()  # extract the endpoints for the x-axis
x_pdf = np.linspace(x0, x1, 100)
y_pdf = scipy.stats.norm.pdf(x_pdf)

ax.plot(x_pdf, y_pdf, 'r', lw=2, label='pdf')                                                     
ax.legend()

enter image description here


你的图为什么只从0.0到0.4?如果我的y轴密度从0到8,我该如何绘制正态分布? - Jiren
@Jiren 密度: 规范化使直方图的总面积等于1。您可能需要查看这个问题 - Trenton McKinney

网页内容由stack overflow 提供, 点击上面的
可以查看英文原文,
原文链接