我正在寻找一种方法来消除x轴上没有数据的“空白”,这是为了bokeh图。
然后我偶然发现了这个例子: 如何在使用日期时间作为x轴时使bokeh省略缺失的日期 这个例子:
当我尝试运行它(使用Bokeh 0.11.1),我总是得到一个空白的浏览器页面。我做错了什么?还有,关于implementation和后面的东西是怎么回事?
更新16/06:
感谢快速回复!我已经尝试使用'bigreddot'答案中找到的新的'implementation'来运行它,但我仍然得到一个空白的浏览器页面。现在我的代码看起来像这样:
然后我偶然发现了这个例子: 如何在使用日期时间作为x轴时使bokeh省略缺失的日期 这个例子:
from math import pi
import pandas as pd
from bokeh.sampledata.stocks import MSFT
from bokeh.plotting import figure, show, output_file
from bokeh.models.formatters import TickFormatter, String, List
# In this custom TickFormatter, xaxis labels are taken from an array of date
# Strings (e.g. ['Sep 01', 'Sep 02', ...]) passed to the date_labels property.
class DateGapTickFormatter(TickFormatter):
date_labels = List(String)
__implementation__ = """
_ = require "underscore"
HasProperties = require "common/has_properties"
class DateGapTickFormatter extends HasProperties
type: 'DateGapTickFormatter'
format: (ticks) ->
date_labels = @get("date_labels")
return (date_labels[tick] ? "" for tick in ticks)
module.exports =
Model: DateGapTickFormatter
"""
df = pd.DataFrame(MSFT)[:50]
# xaxis date labels used in the custom TickFormatter
date_labels = [date.strftime('%b %d') for date in pd.to_datetime(df["date"])]
mids = (df.open + df.close)/2
spans = abs(df.close-df.open)
inc = df.close > df.open
dec = df.open > df.close
w = 0.5
output_file("custom_datetime_axis.html", title="custom_datetime_axis.py example")
TOOLS = "pan,wheel_zoom,box_zoom,reset,save"
p = figure(tools=TOOLS, plot_width=1000, toolbar_location="left")
# Using the custom TickFormatter. You must always define date_labels
p.xaxis[0].formatter = DateGapTickFormatter(date_labels = date_labels)
# x coordinates must be integers. If for example df.index are
# datetimes, you should replace them with a integer sequence
p.segment(df.index, df.high, df.index, df.low, color="black")
p.rect(df.index[inc], mids[inc], w, spans[inc], fill_color="#D5E1DD", line_color="black")
p.rect(df.index[dec], mids[dec], w, spans[dec], fill_color="#F2583E", line_color="black")
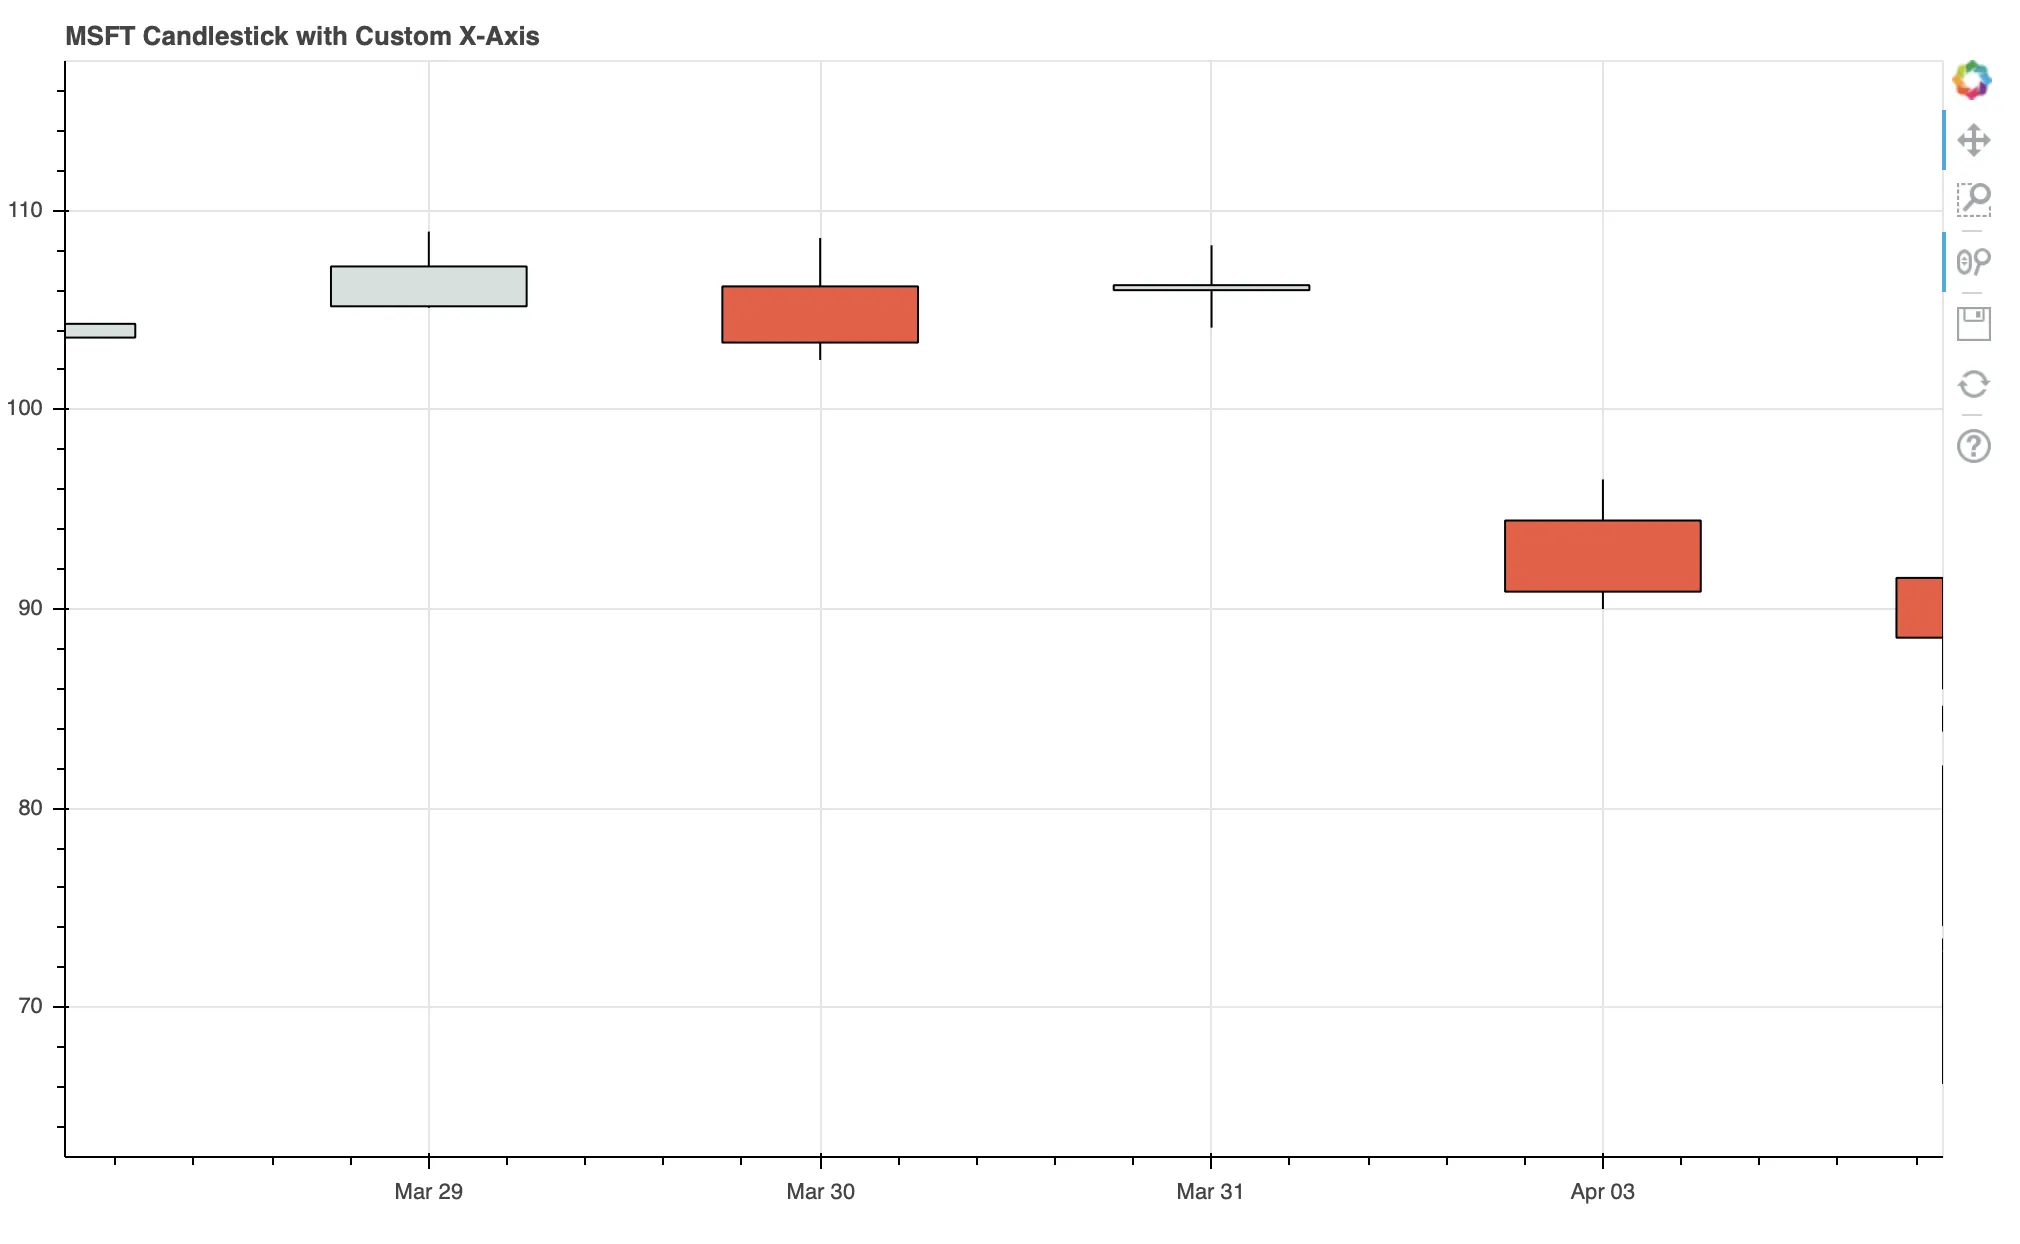
p.title = "MSFT Candlestick with custom x axis"
p.xaxis.major_label_orientation = pi/4
p.grid[0].ticker.desired_num_ticks = 6
show(p) # open a browser
当我尝试运行它(使用Bokeh 0.11.1),我总是得到一个空白的浏览器页面。我做错了什么?还有,关于implementation和后面的东西是怎么回事?
更新16/06:
感谢快速回复!我已经尝试使用'bigreddot'答案中找到的新的'implementation'来运行它,但我仍然得到一个空白的浏览器页面。现在我的代码看起来像这样:
from math import pi
import pandas as pd

from bokeh.sampledata.stocks import MSFT
from bokeh.plotting import figure, show, output_file
from bokeh.models.formatters import TickFormatter, String, List

# In this custom TickFormatter, xaxis labels are taken from an array of date
# Strings (e.g. ['Sep 01', 'Sep 02', ...]) passed to the date_labels property.
class DateGapTickFormatter(TickFormatter):
    date_labels = List(String)

    __implementation__ = """
    _ = require "underscore"
    Model = require "model"
    p = require "core/properties"

    class DateGapTickFormatter extends Model
      type: 'DateGapTickFormatter'

      doFormat: (ticks) ->
        date_labels = @get("date_labels")
        return (date_labels[tick] ? "" for tick in ticks)

      @define {
        date_labels: [ p.Any ]
      }

    module.exports =
      Model: DateGapTickFormatter
    """

df = pd.DataFrame(MSFT)[:50]

# xaxis date labels used in the custom TickFormatter
date_labels = [date.strftime('%b %d') for date in pd.to_datetime(df["date"])]

mids = (df.open + df.close)/2
spans = abs(df.close-df.open)

inc = df.close > df.open
dec = df.open > df.close
w = 0.5

output_file("custom_datetime_axis.html", title="custom_datetime_axis.py example")

TOOLS = "pan,wheel_zoom,box_zoom,reset,save"

p = figure(tools=TOOLS, plot_width=1000, toolbar_location="left")

# Using the custom TickFormatter. You must always define date_labels
p.xaxis[0].formatter = DateGapTickFormatter(date_labels = date_labels)

# x coordinates must be integers. If for example df.index are
# datetimes, you should replace them with a integer sequence
p.segment(df.index, df.high, df.index, df.low, color="black")
p.rect(df.index[inc], mids[inc], w, spans[inc], fill_color="#D5E1DD", line_color="black")
p.rect(df.index[dec], mids[dec], w, spans[dec], fill_color="#F2583E", line_color="black")

p.title = "MSFT Candlestick with custom x axis"
p.xaxis.major_label_orientation = pi/4

p.grid[0].ticker.desired_num_ticks = 6

show(p)
我有所遗漏吗?
__implementation__,Bokeh不支持用户扩展,因此您可以轻松地自行添加新功能和特性,而无需等待项目发布时间表或核心开发人员。这是一个用户自定义模型的示例。 - bigreddot