如何在以日期时间为 X 轴时使 Bokeh 忽略缺失的日期?

6
我正在查看bokeh文档中的蜡烛图示例,链接在这里:https://github.com/bokeh/bokeh/blob/master/examples/plotting/file/candlestick.py ,我正在尝试找到一种有效的方法来消除x轴上没有数据的“空白”处。具体而言,对于类似于示例中使用的MSFT的金融数据,周末和假期没有数据。是否有一种方法可以告诉bokeh在日期没有数据时不要在图表中留下空白空间?以下是方便起见从上面链接中找到的示例代码:
from math import pi
import pandas as pd

from bokeh.sampledata.stocks import MSFT
from bokeh.plotting import *

df = pd.DataFrame(MSFT)[:50]
df['date'] = pd.to_datetime(df['date'])

mids = (df.open + df.close)/2
spans = abs(df.close-df.open)

inc = df.close > df.open
dec = df.open > df.close
w = 12*60*60*1000 # half day in ms

output_file("candlestick.html", title="candlestick.py example")

figure(x_axis_type = "datetime", tools="pan,wheel_zoom,box_zoom,reset,previewsave",
   width=1000, name="candlestick")

hold()

segment(df.date, df.high, df.date, df.low, color='black')
rect(df.date[inc], mids[inc], w, spans[inc], fill_color="#D5E1DD", line_color="black")
rect(df.date[dec], mids[dec], w, spans[dec], fill_color="#F2583E", line_color="black")

curplot().title = "MSFT Candlestick"
xaxis().major_label_orientation = pi/4
grid().grid_line_alpha=0.3

show()  # open a browser
2个回答

5

更新:从 Bokeh 0.12.6 开始,您可以在轴上指定主刻度标签的覆盖。

import pandas as pd

from bokeh.io import show, output_file
from bokeh.plotting import figure
from bokeh.sampledata.stocks import MSFT

df = pd.DataFrame(MSFT)[:50]
inc = df.close > df.open
dec = df.open > df.close

p = figure(plot_width=1000, title="MSFT Candlestick with Custom X-Axis")

# map dataframe indices to date strings and use as label overrides
p.xaxis.major_label_overrides = {
    i: date.strftime('%b %d') for i, date in enumerate(pd.to_datetime(df["date"]))
}

# use the *indices* for x-axis coordinates, overrides will print better labels
p.segment(df.index, df.high, df.index, df.low, color="black")
p.vbar(df.index[inc], 0.5, df.open[inc], df.close[inc], fill_color="#D5E1DD", line_color="black")
p.vbar(df.index[dec], 0.5, df.open[dec], df.close[dec], fill_color="#F2583E", line_color="black")

output_file("custom_datetime_axis.html", title="custom_datetime_axis.py example")

show(p)

enter image description here

如果你有大量的日期,这种方法可能变得笨重,需要使用自定义扩展


这个请求有任何进展吗,或者已知有解决方法吗?在MPL中,您可以使用基于整数的X轴,然后应用自定义标签,使其看起来像是一个时间序列轴。 - dave
有一个新问题需要添加对“缩放”功能的支持,以便可以将例如过夜时间“压缩”,如果不希望有数据。这与上述描述的破碎轴不完全相同,但可能很有用。尽管如此,这种东西对于时间比对于日期更有用。总的来说,日历是一个非常困难的问题。 - bigreddot
有趣的是,我更感兴趣的是消除周末间隙而不是隔夜间隙。许多市场每天24小时开放,除了周末。上述解决方法在bokeh中是否可行?例如,使用整数作为X轴,并使用日期标签数组进行显示。在这种情况下,如果星期五表示为x = 6,则星期一的数据将表示为x = 7。如果您有一个感兴趣的pandas DF,则只需调用df.reset_index()即可创建连续的“无间隙”整数索引。 - dave
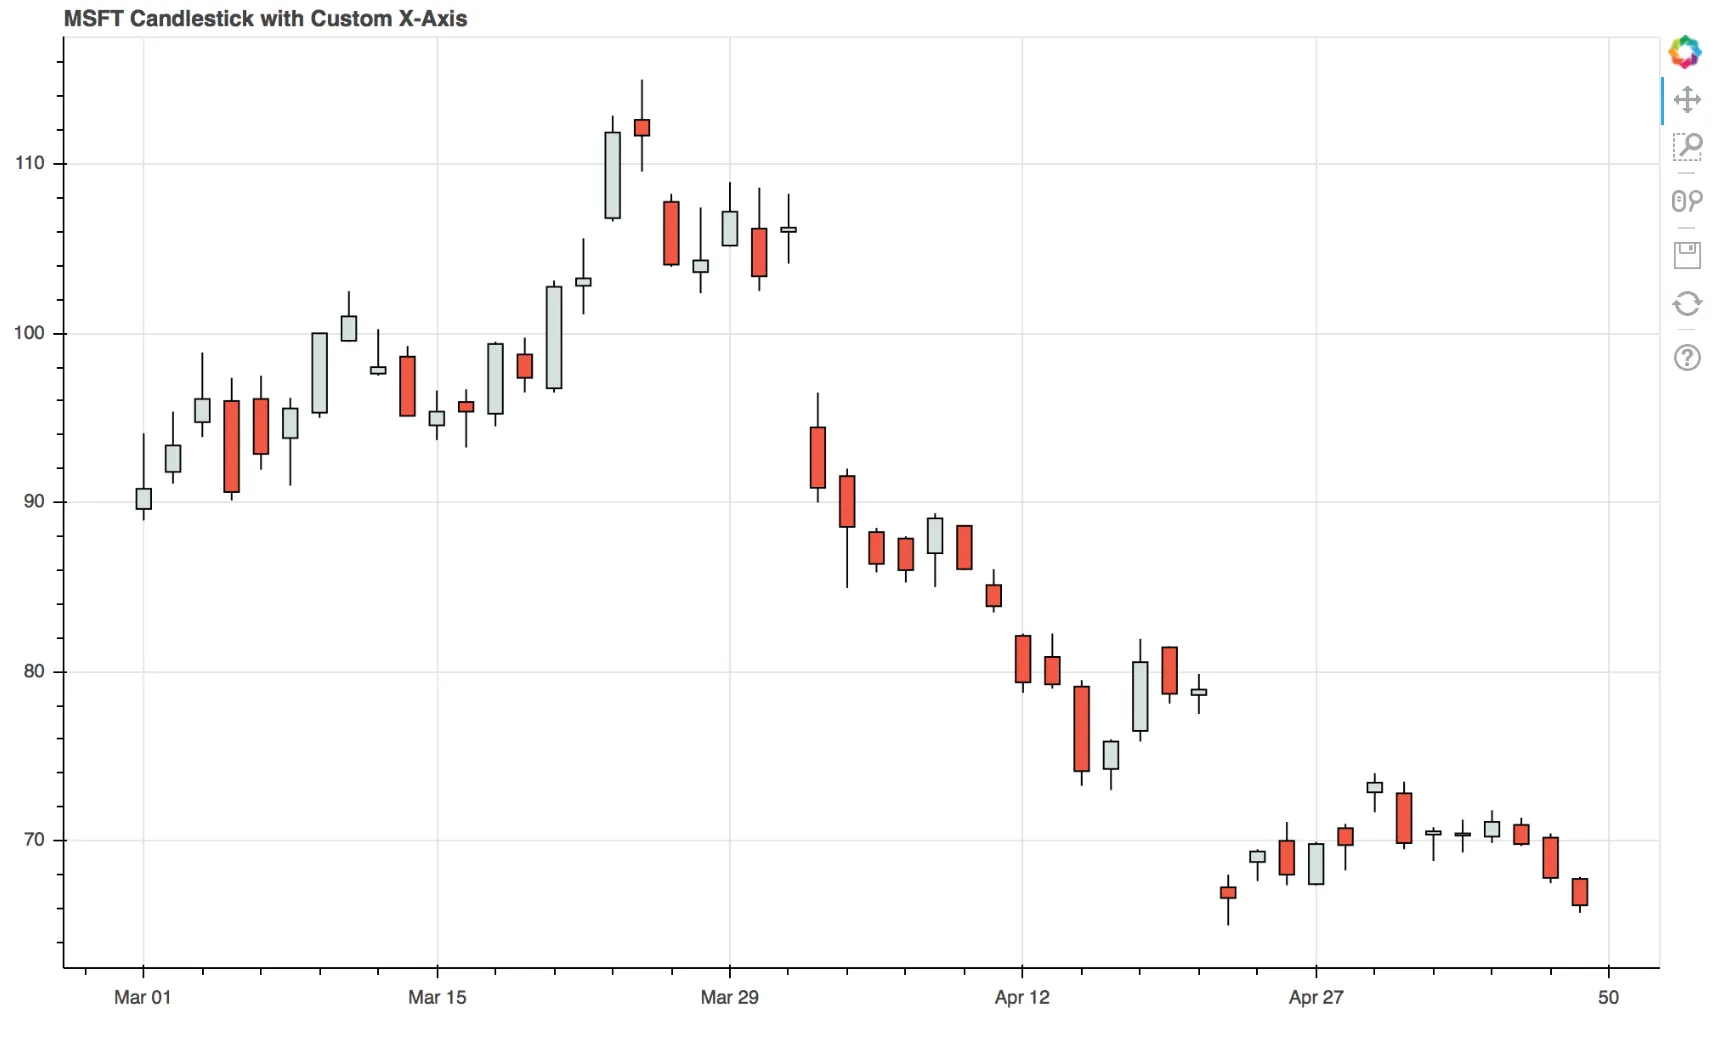
df = pd.DataFrame(MSFT)[:100],然后你执行了df = df.drop(df.index[len(df.index) // 4:3 * len(df.index) // 4])以删除中间的50个(即保留头部25个和尾部25个)。但是这似乎没有起作用,它留下了一个50的空隙并自动填充了数字。我是否漏掉了什么或者Bokeh 2.2.3(当前版本)不像以前那样工作了? - levant pied
这里的方法假设并依赖于索引是单调递增的整数且没有间隙。如果您在中间删除部分,则需要重新索引df - bigreddot

0

更新于2016-05-26:

BokehJS接口的一些细节已经发生了变化。对于Bokeh 0.11及更高版本,__implementation__现在应该是:

__implementation__ = """
    _ = require "underscore"
    Model = require "model"
    p = require "core/properties"

    class DateGapTickFormatter extends Model
      type: 'DateGapTickFormatter'

      doFormat: (ticks) ->
        date_labels = @get("date_labels")
        return (date_labels[tick] ? "" for tick in ticks)

      @define {
        date_labels: [ p.Any ]
      }

    module.exports =
      Model: DateGapTickFormatter
"""

这不会再有任何改变。

2016-02-09

拉取请求 3314 是为了一个在 2015-12-05 上运行的示例。原始代码在此处K线图示例的文档仍显示与 OP 在问题中提出的相同代码。

以下是供参考。

from math import pi

import pandas as pd

from bokeh.sampledata.stocks import MSFT
from bokeh.plotting import figure, show, output_file
from bokeh.models.formatters import TickFormatter, String, List

# In this custom TickFormatter, xaxis labels are taken from an array of date
# Strings (e.g. ['Sep 01', 'Sep 02', ...]) passed to the date_labels property. 
class DateGapTickFormatter(TickFormatter):
    date_labels = List(String)

    __implementation__ = """
_ = require "underscore"
HasProperties = require "common/has_properties"

class DateGapTickFormatter extends HasProperties
  type: 'DateGapTickFormatter'

  format: (ticks) ->
    date_labels = @get("date_labels")
    return (date_labels[tick] ? "" for tick in ticks)

module.exports =
  Model: DateGapTickFormatter
"""

df = pd.DataFrame(MSFT)[:50]

# xaxis date labels used in the custom TickFormatter
date_labels = [date.strftime('%b %d') for date in pd.to_datetime(df["date"])]

mids = (df.open + df.close)/2
spans = abs(df.close-df.open)

inc = df.close > df.open
dec = df.open > df.close
w = 0.5

output_file("custom_datetime_axis.html", title="custom_datetime_axis.py example")

TOOLS = "pan,wheel_zoom,box_zoom,reset,save"

p = figure(tools=TOOLS, plot_width=1000, toolbar_location="left")

# Using the custom TickFormatter. You must always define date_labels
p.xaxis[0].formatter = DateGapTickFormatter(date_labels = date_labels)

# x coordinates must be integers. If for example df.index are 
# datetimes, you should replace them with a integer sequence
p.segment(df.index, df.high, df.index, df.low, color="black")
p.rect(df.index[inc], mids[inc], w, spans[inc], fill_color="#D5E1DD", line_color="black")
p.rect(df.index[dec], mids[dec], w, spans[dec], fill_color="#F2583E", line_color="black")

p.title = "MSFT Candlestick with custom x axis"
p.xaxis.major_label_orientation = pi/4

p.grid[0].ticker.desired_num_ticks = 6

show(p)  # open a browser

由于代码使用了 dataframe 的索引,您的数据必须按照日期升序排序。如果您有一个按照日期降序排列的时间序列,则可以使用以下代码将其反转以供上述代码使用:

df.sort_values(by='date', inplace=True)
df.reset_index(drop=True, inplace=True)

网页内容由stack overflow 提供, 点击上面的
可以查看英文原文,
原文链接