我将尝试绘制以下简单的热力图:
data = {
    'value': [1, 2, 3, 4, 5, 6],
    'x': [datetime(2016, 10, 25, 0, 0),
          datetime(2016, 10, 25, 8, 0),
          datetime(2016, 10, 25, 16, 0),
          datetime(2016, 10, 25, 0, 0),
          datetime(2016, 10, 25, 8, 0),
          datetime(2016, 10, 25, 16, 0)],
    'y': ['param1', 'param1', 'param1', 'param2', 'param2', 'param2']
}
hm = HeatMap(data, x='x', y='y', values='value', stat=None)
output_file('heatmap.html')
show(hm)
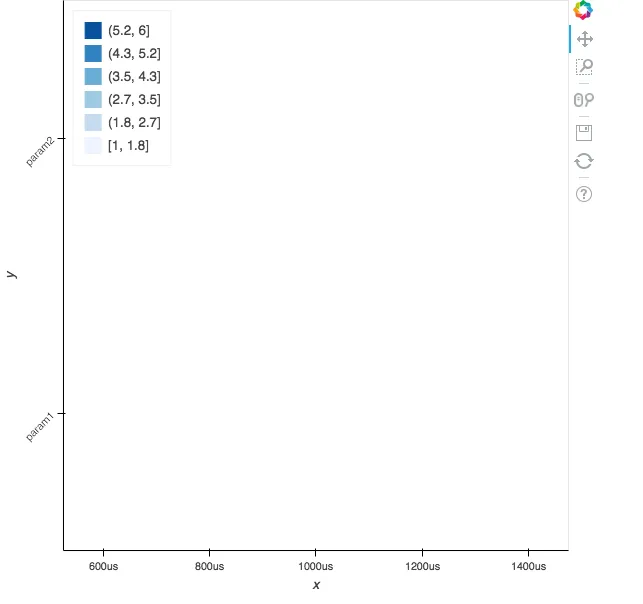
很遗憾,它无法正确渲染:
我尝试设置x_range,但似乎没有任何效果。
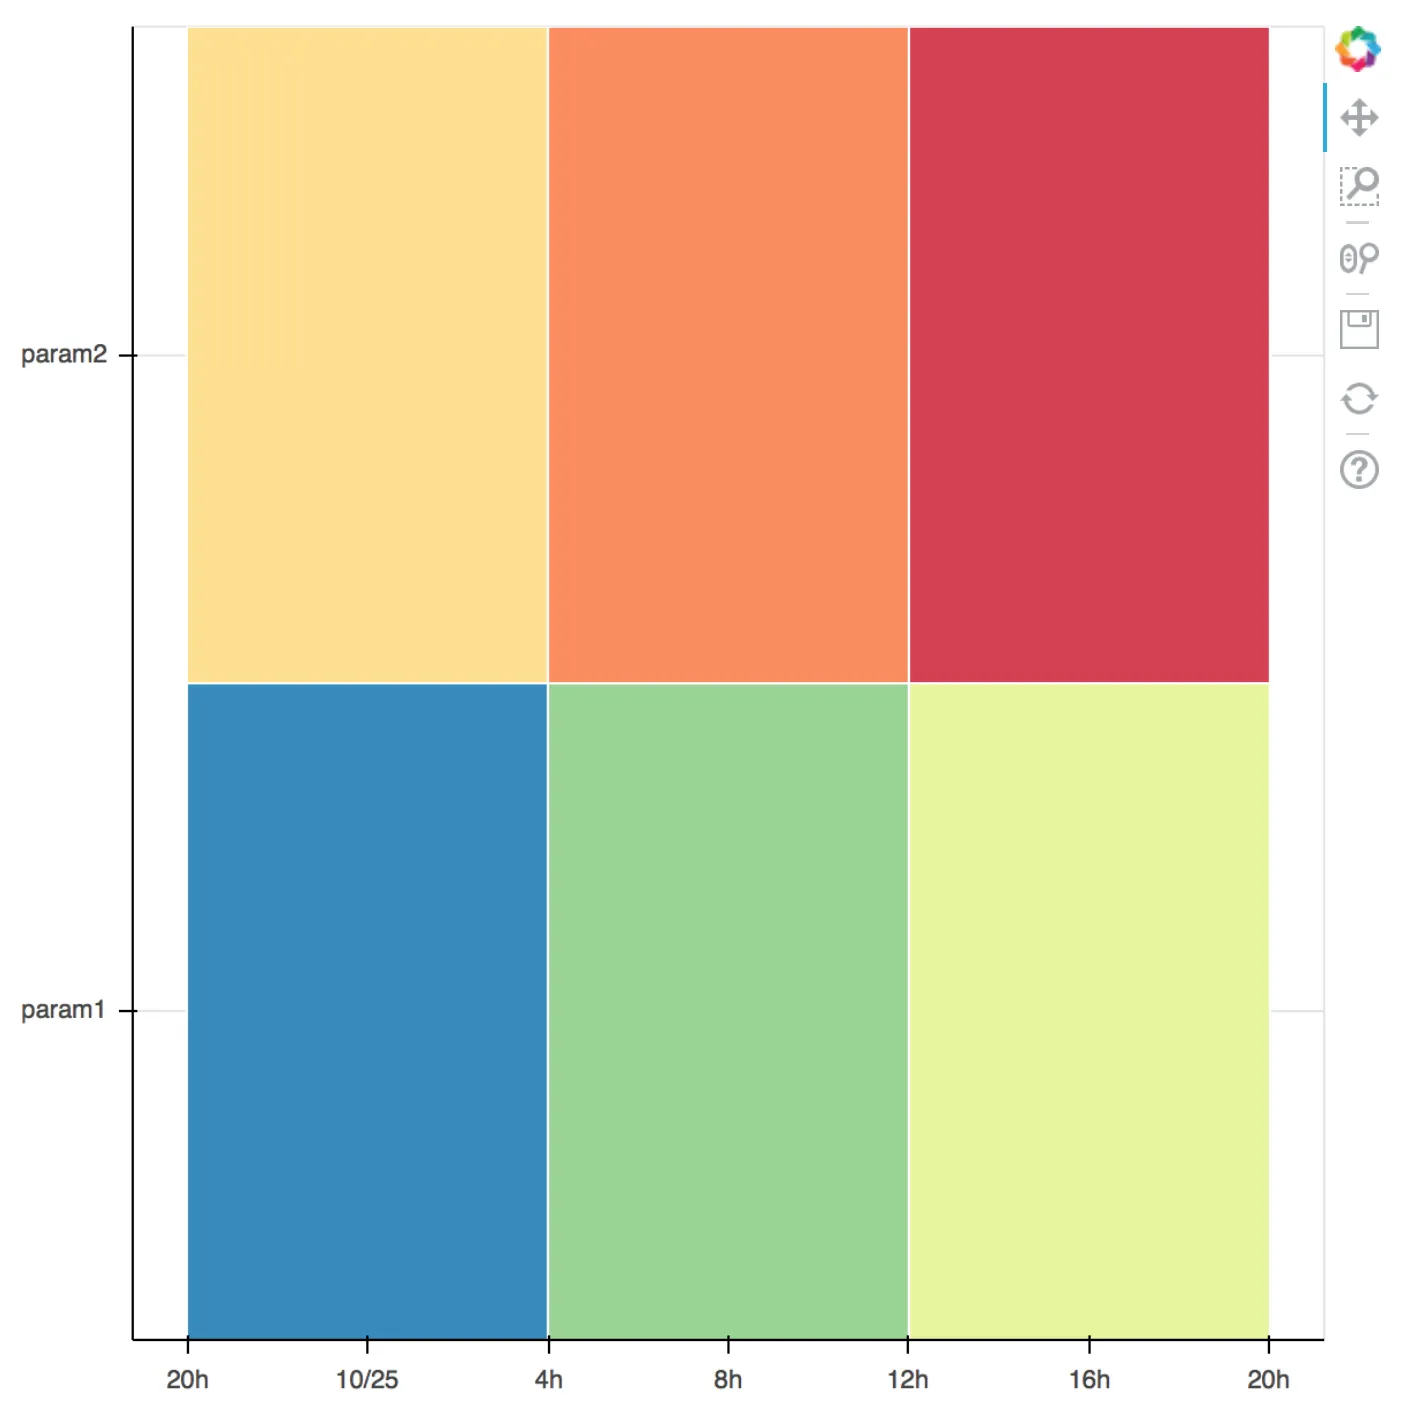
我使用以下代码成功地解决了这个问题:
d1 = data['x'][0]
d2 = data['x'][-1]

p = figure(
    x_axis_type="datetime", x_range=(d1, d2), y_range=data['y'],
    tools='xpan, xwheel_zoom, reset, save, resize,'
)

p.rect(
    source=ColumnDataSource(data), x='x', y='y', width=12000000, height=1,
)
但是,一旦我尝试使用缩放工具,就会在控制台中看到以下错误:
Uncaught Error: Number property 'start' given invalid value:
Uncaught TypeError: Cannot read property 'indexOf' of null
我使用的是 Bokeh 0.12.3 版本。
bokeh.charts。请参见http://bokeh.pydata.org/en/latest/docs/user_guide/categorical.html#heat-maps。 - bigreddot