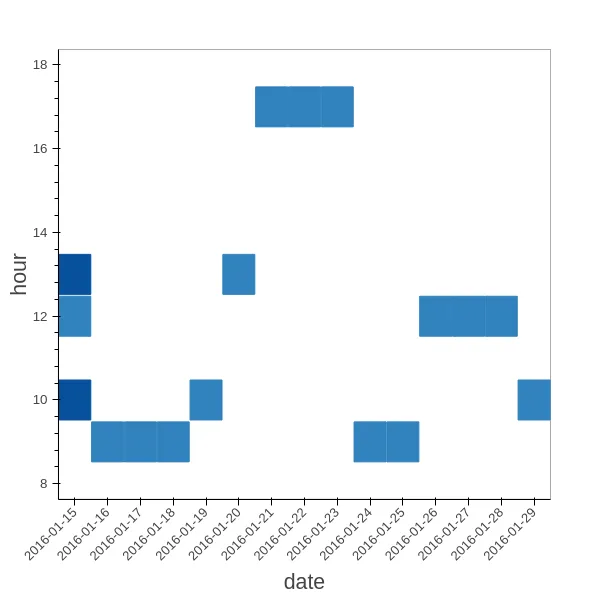
我有一组带时间戳的事件数组,想要创建热力图:
- x轴应该表示日期,例如“2016-02-03”,
- y轴应该表示发生的小时数,例如13(如果是13:32),
- 颜色应该取决于发生事件的数量。
我的数据(作为pandas dataframe z.head()):
         date hour  i
0  2016-01-15   13  1
1  2016-01-15   13  1
2  2016-01-15   12  1
3  2016-01-15   10  1
4  2016-01-15   10  1
我的失败尝试:
from bokeh._legacy_charts import HeatMap, output_file, show
hm = HeatMap(z.head(), x='date', y='hour', values='i', stat='count')
还有一个例外:
AttributeError                            Traceback (most recent call last)
<ipython-input-98-83c7e9319496> in <module>()
----> 1 hm = HeatMap(z.head(), x='date', y='hour', values='i', stat='count')

/home/user/.local/lib/python3.4/site-packages/bokeh/charts/builders/heatmap_builder.py in HeatMap(data, x, y, values, stat, xgrid, ygrid, hover_tool, hover_text, **kw)
     90     kw['values'] = values
     91     kw['stat'] = stat
---> 92     chart = create_and_build(HeatMapBuilder, data, xgrid=xgrid, ygrid=ygrid, **kw)
     93
     94     if hover_tool:

/home/user/.local/lib/python3.4/site-packages/bokeh/charts/builder.py in create_and_build(builder_class, *data, **kws)
     65     chart_kws = { k:v for k,v in kws.items() if k not in builder_props}
     66     chart = Chart(**chart_kws)
---> 67     chart.add_builder(builder)
     68     chart.start_plot()
     69

/home/user/.local/lib/python3.4/site-packages/bokeh/charts/chart.py in add_builder(self, builder)
    150     def add_builder(self, builder):
    151         self._builders.append(builder)
--> 152         builder.create(self)
    153
    154     def add_ranges(self, dim, range):

/home/user/.local/lib/python3.4/site-packages/bokeh/charts/builder.
    510         # call methods that allow customized setup by subc
    511         self.setup()
--> 512         self.process_data()
    513
    514         # create and add renderers to chart

/home/user/.local/lib/python3.4/site-packages/bokeh/charts/builders
    169         # color by the values selection
    170         self.attributes['color'].setup(data=self._data.sou
--> 171                                        columns=self.values
    172         self.attributes['color'].add_bin_labels(self._data
    173

/home/user/.local/lib/python3.4/site-packages/bokeh/charts/attribut
    187
    188         if self.columns is not None and self.data is not N
--> 189             self.attr_map = self._create_attr_map(self.dat
    190
    191     def update_data(self, data):

/home/user/.local/lib/python3.4/site-packages/bokeh/charts/attribut
    158         """Creates map between unique values and available
    159
--> 160         self._generate_items(df, columns)
    161         iterable = self._setup_iterable()
    162

/home/user/.local/lib/python3.4/site-packages/bokeh/charts/attribut
    230
    231                 self.bins = Bins(source=ColumnDataSource(d
--> 232                                  bin_count=len(self.iterab
    233
    234                 if self.sort:

/home/user/.local/lib/python3.4/site-packages/bokeh/charts/stats.py
    309         properties['source'] = source
    310
--> 311         super(Bins, self).__init__(**properties)
    312
    313     def _get_stat(self):

/home/user/.local/lib/python3.4/site-packages/bokeh/charts/stats.py
     54
     55         super(Stat, self).__init__(**properties)
---> 56         self._refresh()
     57
     58     def _refresh(self):

/home/user/.local/lib/python3.4/site-packages/bokeh/charts/stats.py
     60         if self.get_data() is not None:
     61             self.update()
---> 62             self.calculate()
     63
     64     def set_data(self, data, column=None):

/home/user/.local/lib/python3.4/site-packages/bokeh/charts/stats.py
    342         if self.source is not None:
    343             # add bin column to data source
--> 344             self.source.add(binned.tolist(), name=self.bin
    345             df = self.source.to_df()
    346         else:

AttributeError: 'Categorical' object has no attribute 'tolist'
Bokeh是在0.11版本中通过pip3安装的。我做错了什么?谢谢。
更新:
- 我的legacy_charts写错了(复制了错误的行)。
- 我已经重新安装了Bokeh
pip3 install --user --force-reinstall --upgrade bokeh。仍然没有成功。
完整代码:
import pandas as pd
from bokeh.charts import HeatMap, output_file, show

z = pd.DataFrame()
z['date'] = ['2016-01-15', '2016-01-13', '2016-01-11', '2016-01-14', '2016-01-15']
z['hour'] = [12, 10, 11, 3, 0]
z['i'] = [1, 1, 1, 1, 1]

output_file('/tmp/test.html')
hm = HeatMap(z, x='date', y='hour', stat='count')
show(hm)
并且使用Python3运行:
Traceback (most recent call last):
  File "so.py", line 10, in <module>
    hm = HeatMap(z, x='date', y='hour', stat='count')
  File "/home/ktx/.local/lib/python3.4/site-packages/bokeh/charts/builders/heatmap_builder.py", line 92, in HeatMap
    chart = create_and_build(HeatMapBuilder, data, xgrid=xgrid, ygrid=ygrid, **kw)
  File "/home/ktx/.local/lib/python3.4/site-packages/bokeh/charts/builder.py", line 67, in create_and_build
    chart.add_builder(builder)
  File "/home/ktx/.local/lib/python3.4/site-packages/bokeh/charts/chart.py", line 152, in add_builder
    builder.create(self)
  File "/home/ktx/.local/lib/python3.4/site-packages/bokeh/charts/builder.py", line 512, in create
    self.process_data()
  File "/home/ktx/.local/lib/python3.4/site-packages/bokeh/charts/builders/heatmap_builder.py", line 171, in process_data
    columns=self.values.selection)
  File "/home/ktx/.local/lib/python3.4/site-packages/bokeh/charts/attributes.py", line 189, in setup
    self.attr_map = self._create_attr_map(self.data.to_df(), self.columns)
  File "/home/ktx/.local/lib/python3.4/site-packages/bokeh/charts/attributes.py", line 160, in _create_attr_map
    self._generate_items(df, columns)
  File "/home/ktx/.local/lib/python3.4/site-packages/bokeh/charts/attributes.py", line 232, in _generate_items
    bin_count=len(self.iterable), aggregate=False)
  File "/home/ktx/.local/lib/python3.4/site-packages/bokeh/charts/stats.py", line 311, in __init__
    super(Bins, self).__init__(**properties)
  File "/home/ktx/.local/lib/python3.4/site-packages/bokeh/charts/stats.py", line 56, in __init__
    self._refresh()
  File "/home/ktx/.local/lib/python3.4/site-packages/bokeh/charts/stats.py", line 62, in _refresh
    self.calculate()
  File "/home/ktx/.local/lib/python3.4/site-packages/bokeh/charts/stats.py", line 344, in calculate
    self.source.add(binned.tolist(), name=self.bin_column)
AttributeError: 'Categorical' object has no attribute 'tolist'
bokeh._legacy_charts已被删除,在Bokeh版本0.11中不存在。也许尝试完全删除并重新安装。 - bigreddot