我想在matplotlib绘图中为x轴分配完整的日期和时间,但是使用自动缩放功能只能获取时间或日期,而不能同时获取两者。
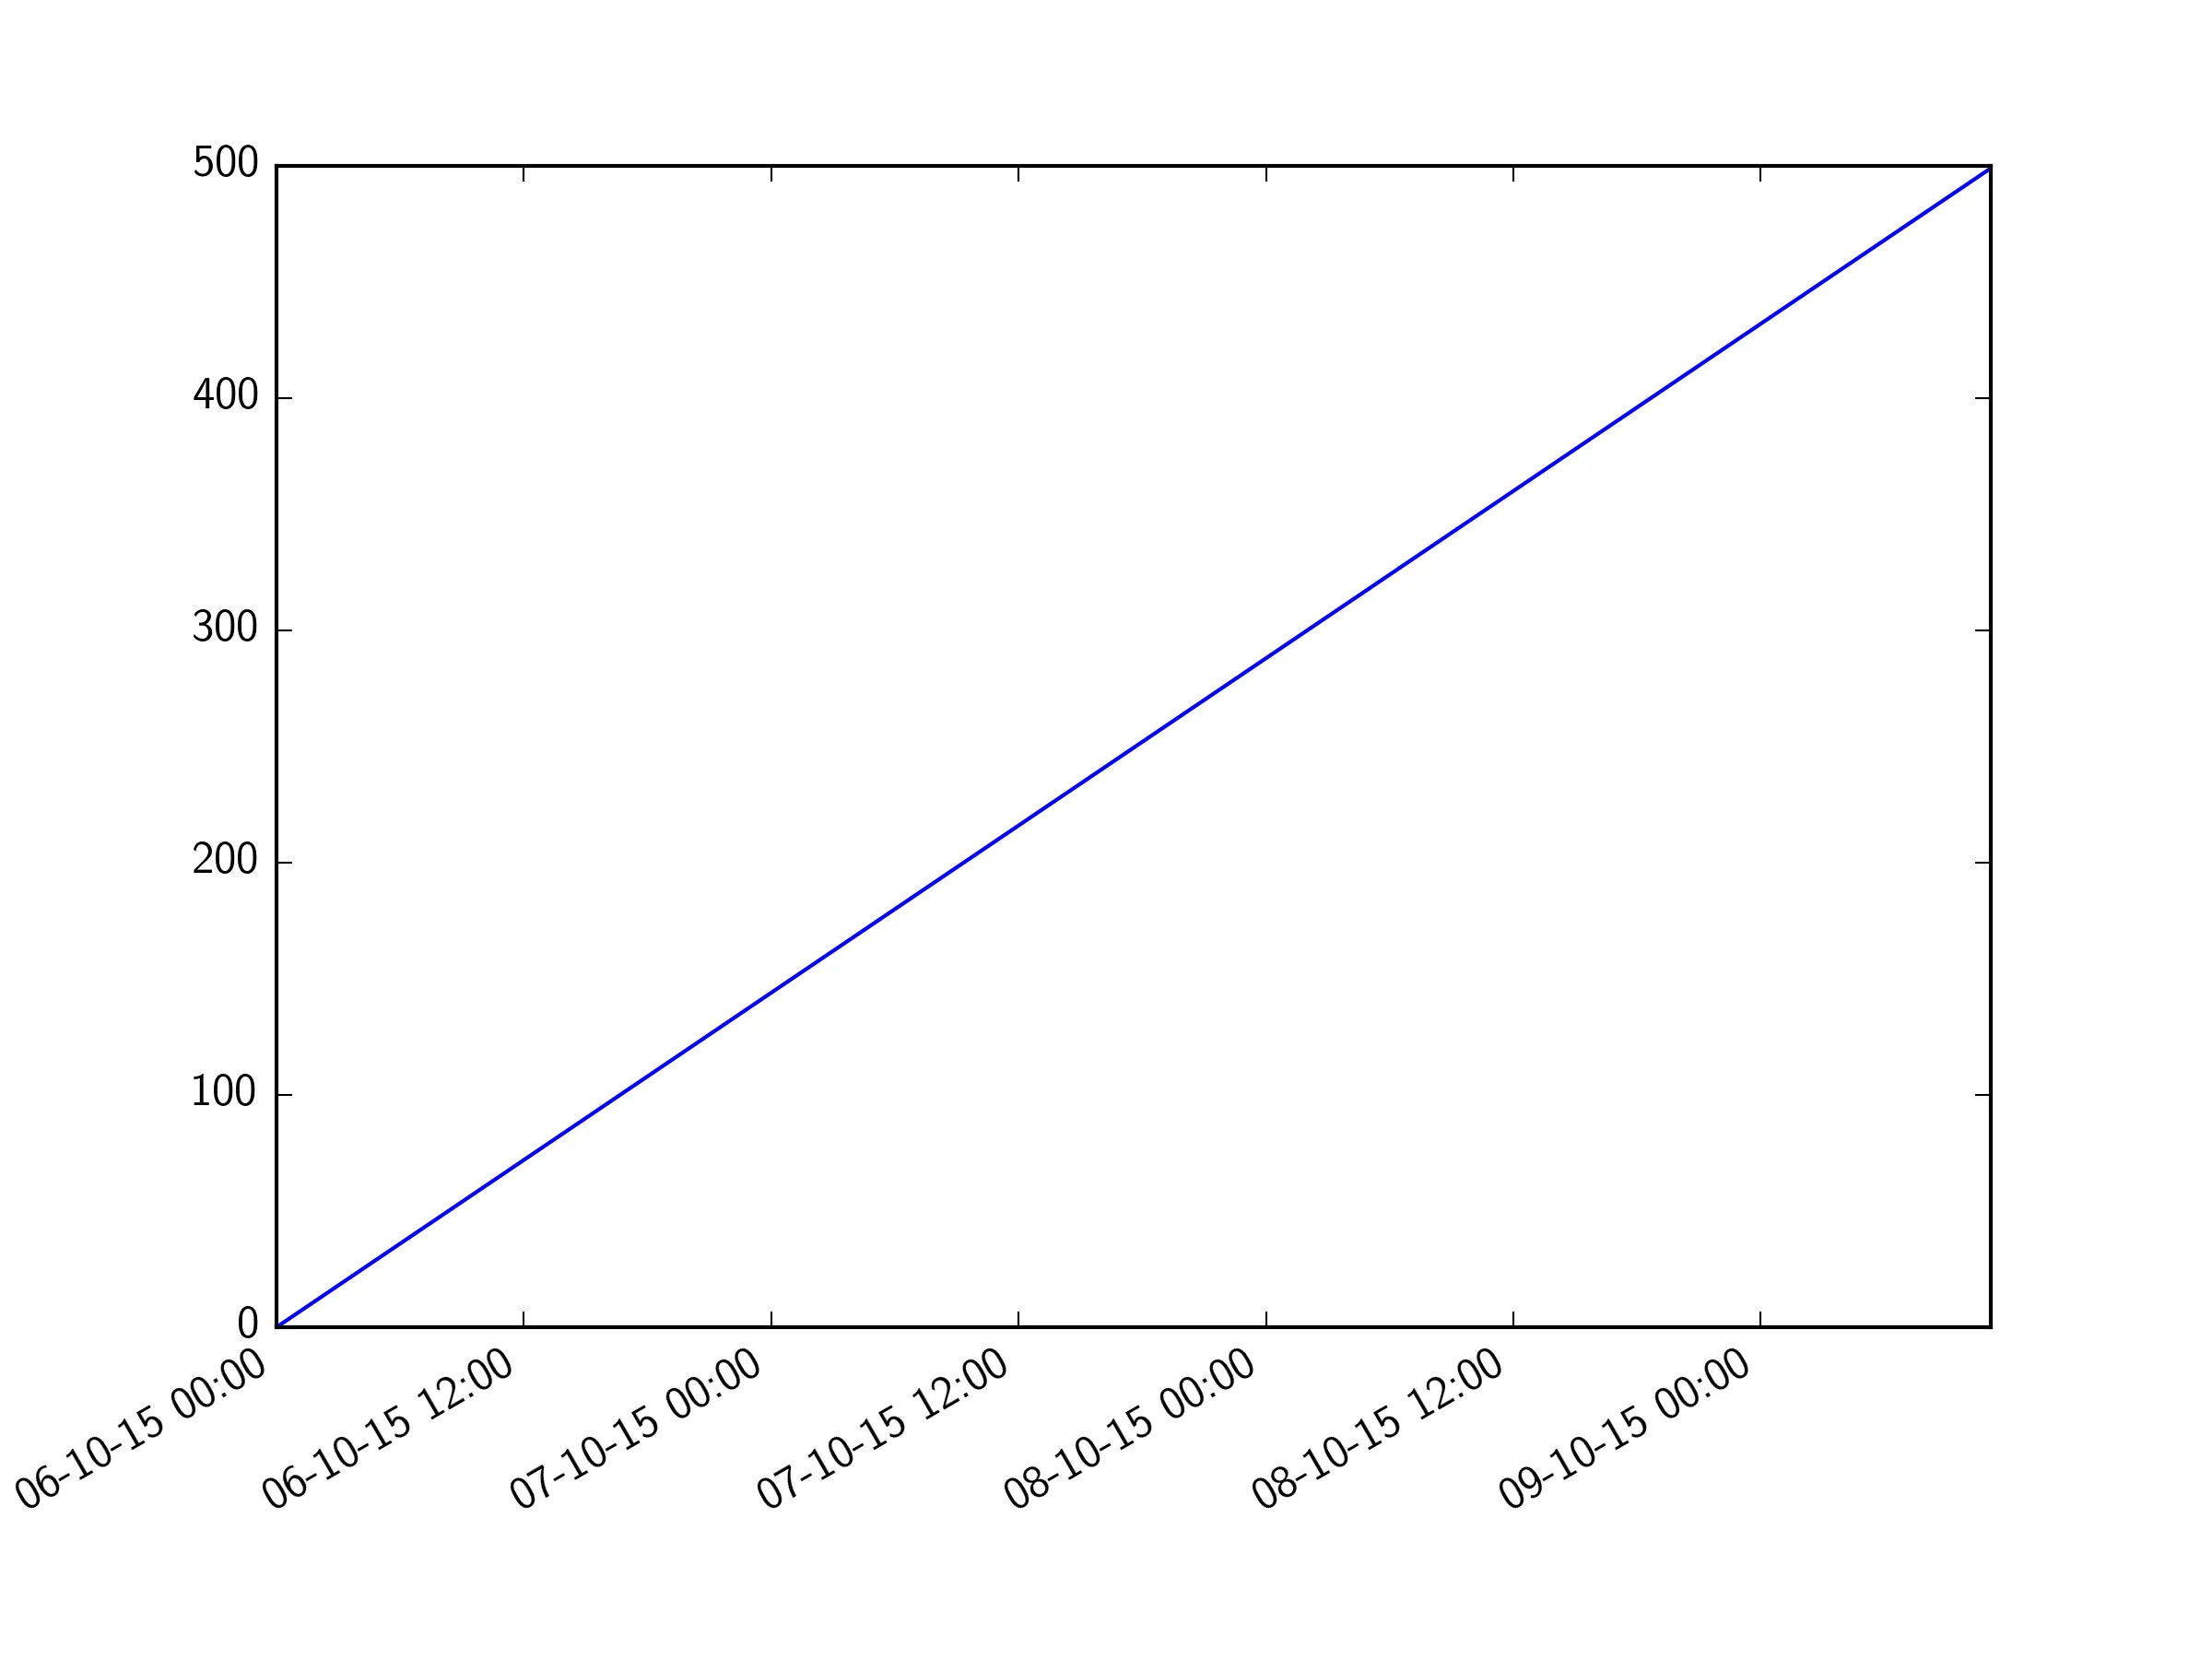
在x轴上,我只得到了时间,没有日期,所以很难区分测量结果。
我认为在matplotlib.dates.AutoDateFormatter中有一些选项,但我找不到任何一个可以让我改变自动缩放的选项。
import matplotlib.pyplot as plt
import pandas as pd
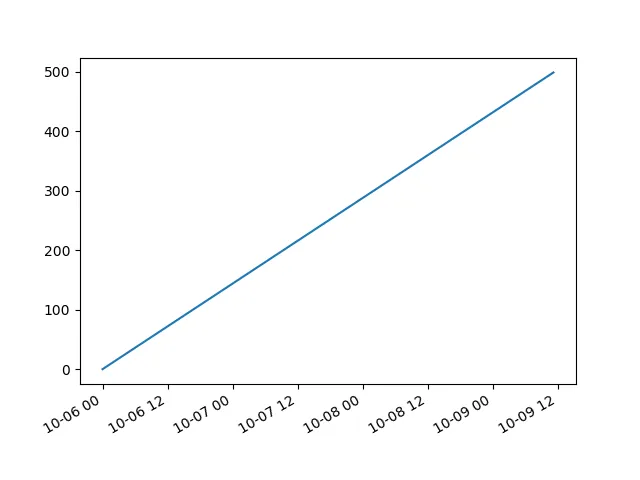
times = pd.date_range('2015-10-06', periods=500, freq='10min')
fig, ax = plt.subplots(1)
fig.autofmt_xdate()
plt.plot(times, range(times.size))
plt.show()
在x轴上,我只得到了时间,没有日期,所以很难区分测量结果。
我认为在matplotlib.dates.AutoDateFormatter中有一些选项,但我找不到任何一个可以让我改变自动缩放的选项。
ax.xaxis.set_major_locator(mdates.HourLocator(interval=6))来每隔6小时设置一个刻度。请参阅此处的文档以获取不同可用定位器的列表。 - tmdavison