这个问题已经得到了彻底的回答,因此我认为对所提出方法的运行时分析会很有兴趣(对我来说确实是这样)。 我还将研究这些方法在嘈杂数据集的中心和边缘的行为。
简而言之
| runtime in s | runtime in s
method | python list | numpy array
kernel regression | 23.93405 | 22.75967
lowess | 0.61351 | 0.61524
naive average | 0.02485 | 0.02326
others* | 0.00150 | 0.00150
fft | 0.00021 | 0.00021
numpy convolve | 0.00017 | 0.00015
*savgol with different fit functions and some numpy methods
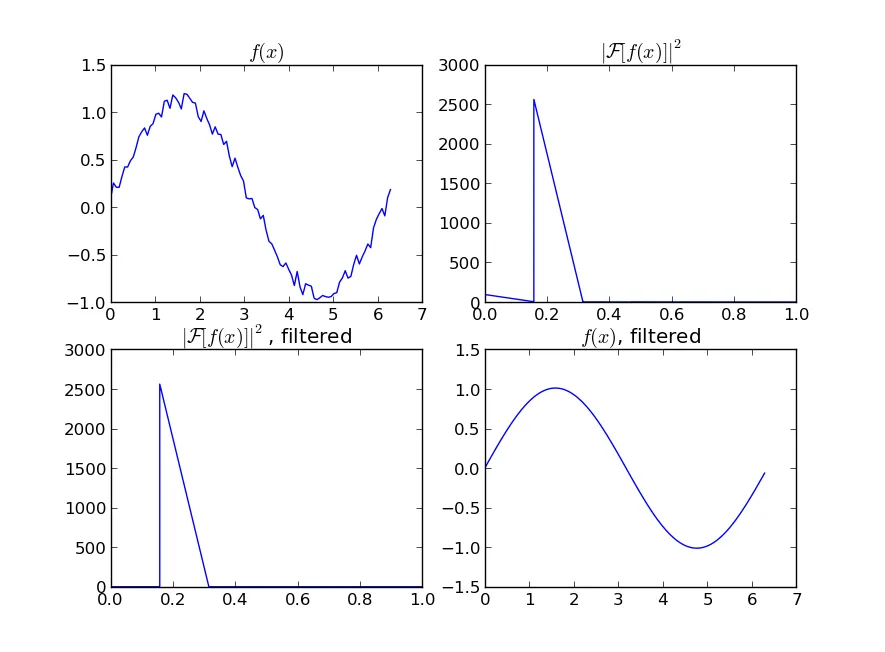
Kernel回归的缩放效果不佳,Lowess要快一些,但两者都会产生平滑曲线。Savgol在速度上是一个折中方案,可以根据多项式的级数产生跳跃或平滑的输出。FFT非常快,但只适用于周期性数据。
Numpy的移动平均方法更快,但显然会产生一个有台阶的图形。
设置
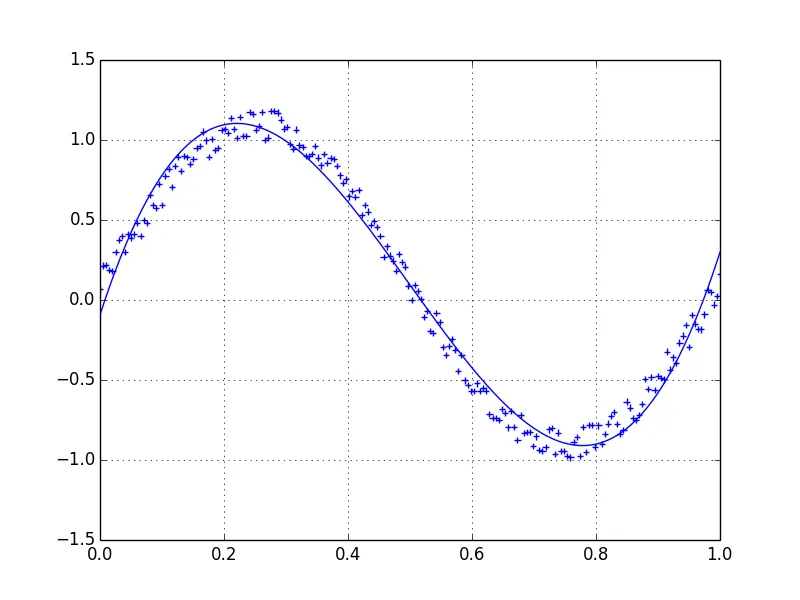
我用正弦曲线形状生成了1000个数据点:
size = 1000
x = np.linspace(0, 4 * np.pi, size)
y = np.sin(x) + np.random.random(size) * 0.2
data = {"x": x, "y": y}
我将这些参数传入一个函数来测量运行时间,并绘制结果的拟合曲线:
def test_func(f, label):  # f: function handle to one of the smoothing methods
    start = time()
    for i in range(5):
        arr = f(data["y"], 20)
    print(f"{label:26s} - time: {time() - start:8.5f} ")
    plt.plot(data["x"], arr, "-", label=label)
我测试了许多不同的平滑函数。 arr 是待平滑的 y 值数组,span 是平滑参数。参数越小,拟合结果将越接近原始数据,参数越大,平滑后的曲线将会更加平滑。
def smooth_data_convolve_my_average(arr, span):
re = np.convolve(arr, np.ones(span * 2 + 1) / (span * 2 + 1), mode="same")
re[0] = np.average(arr[:span])
for i in range(1, span + 1):
re[i] = np.average(arr[:i + span])
re[-i] = np.average(arr[-i - span:])
return re
def smooth_data_np_average(arr, span):
return [np.average(arr[val - span:val + span + 1]) for val in range(len(arr))]
def smooth_data_np_convolve(arr, span):
return np.convolve(arr, np.ones(span * 2 + 1) / (span * 2 + 1), mode="same")
def smooth_data_np_cumsum_my_average(arr, span):
cumsum_vec = np.cumsum(arr)
moving_average = (cumsum_vec[2 * span:] - cumsum_vec[:-2 * span]) / (2 * span)
front, back = [np.average(arr[:span])], []
for i in range(1, span):
front.append(np.average(arr[:i + span]))
back.insert(0, np.average(arr[-i - span:]))
back.insert(0, np.average(arr[-2 * span:]))
return np.concatenate((front, moving_average, back))
def smooth_data_lowess(arr, span):
x = np.linspace(0, 1, len(arr))
return sm.nonparametric.lowess(arr, x, frac=(5*span / len(arr)), return_sorted=False)
def smooth_data_kernel_regression(arr, span):
kr = KernelReg(arr, np.linspace(0, 1, len(arr)), 'c')
return kr.fit()[0]
def smooth_data_savgol_0(arr, span):
return savgol_filter(arr, span * 2 + 1, 0)
def smooth_data_savgol_1(arr, span):
return savgol_filter(arr, span * 2 + 1, 1)
def smooth_data_savgol_2(arr, span):
return savgol_filter(arr, span * 2 + 1, 2)
def smooth_data_fft(arr, span):
w = fftpack.rfft(arr)
spectrum = w ** 2
cutoff_idx = spectrum < (spectrum.max() * (1 - np.exp(-span / 2000)))
w[cutoff_idx] = 0
return fftpack.irfft(w)
结果
速度
测试了一个python列表和一个numpy数组来保存值,对超过1000个元素的运行时间进行了测试。
method              | python list | numpy array
--------------------|-------------|------------
kernel regression   | 23.93405 s  | 22.75967 s
lowess              |  0.61351 s  |  0.61524 s
numpy average       |  0.02485 s  |  0.02326 s
savgol 2            |  0.00186 s  |  0.00196 s
savgol 1            |  0.00157 s  |  0.00161 s
savgol 0            |  0.00155 s  |  0.00151 s
numpy convolve + me |  0.00121 s  |  0.00115 s
numpy cumsum + me   |  0.00114 s  |  0.00105 s
fft                 |  0.00021 s  |  0.00021 s
numpy convolve      |  0.00017 s  |  0.00015 s
特别是核回归在计算超过1k个元素时非常缓慢,当数据集变得更大时,lowess也会失败。尤其是numpy convolve和fft非常快速。我没有研究随着样本大小增加或减少的运行时行为(O(n))。
边缘行为
我将把这一部分分成两部分,以保持图像易于理解。
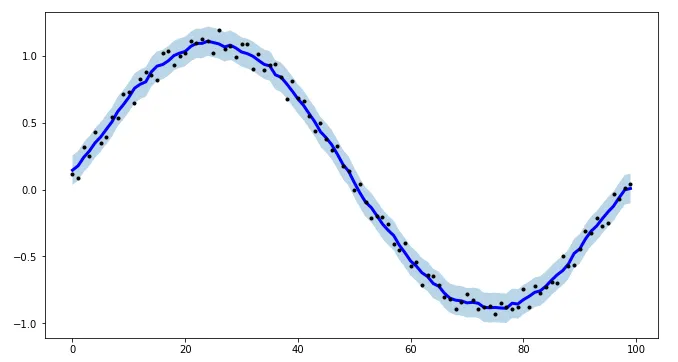
Numpy基于方法+ savgol 0:
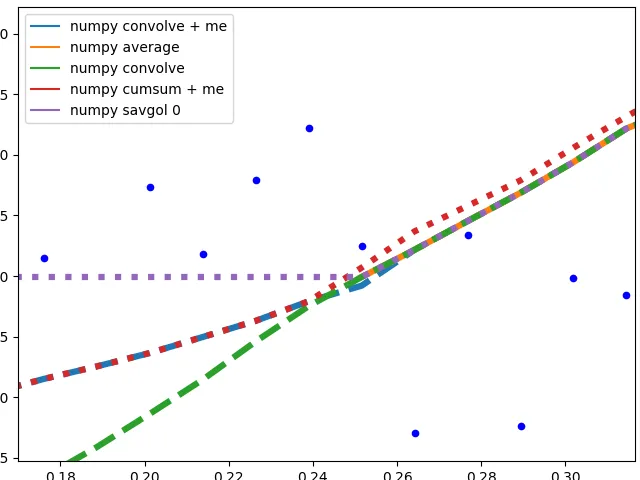
这些方法计算数据的平均值,图形不平滑。当用于计算平均值的窗口未触及数据边缘时,它们(除了numpy.cumsum)产生相同的图形。与numpy.cumsum的差异很可能是由于窗口大小中的 "off by one "错误造成的。
当该方法必须使用较少的数据时,存在不同的边缘行为:
savgol 0:继续带有一个常数到数据边缘(savgol 1和savgol 2分别以线和抛物线结束)numpy average:当窗口达到数据左侧并用Nan填充数组中的这些位置时停止,与右侧的my_average方法具有相同的行为numpy convolve:非常准确地跟随数据。当窗口的一侧到达数据边缘时,我怀疑窗口大小会对称缩小my_average/me:我自己实现的方法,因为我对其他方法不满意。简单地将超出数据范围的窗口部分收缩到数据边缘,但保持另一侧的窗口与给定的原始大小相同。
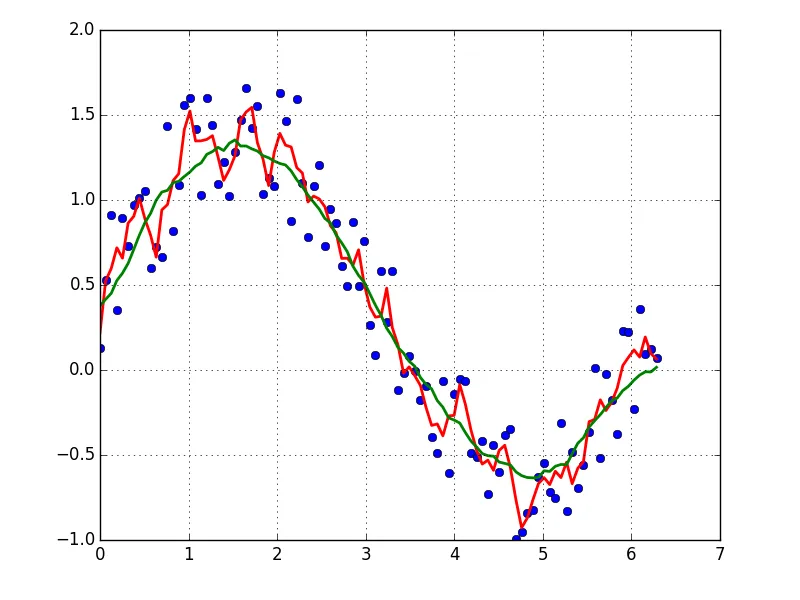
复杂的方法:
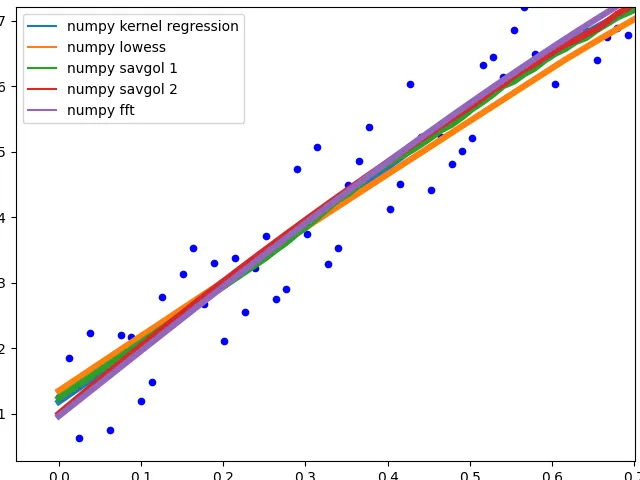
这些方法都以数据的良好拟合结束。savgol 1以直线结束,savgol 2以抛物线结束。
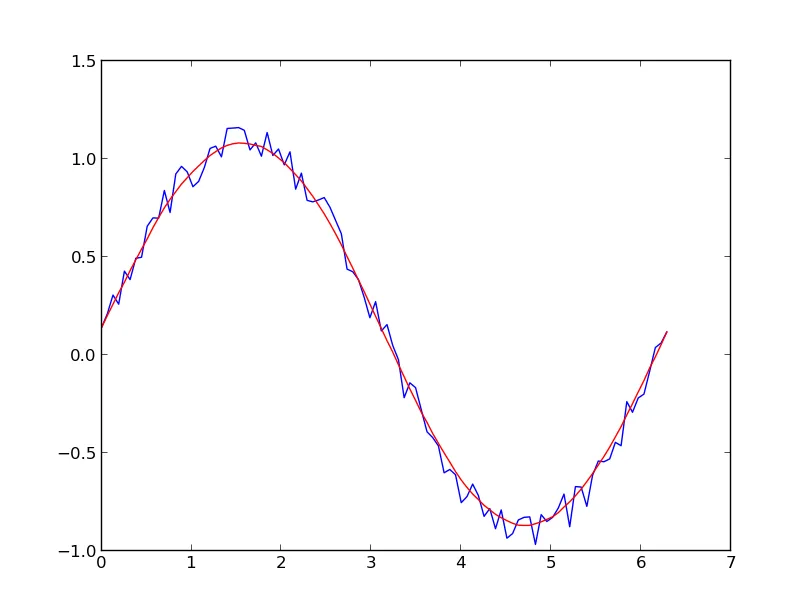
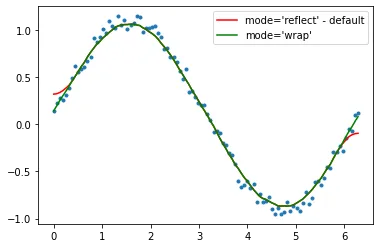
曲线行为
展示不同方法在数据中间的行为。
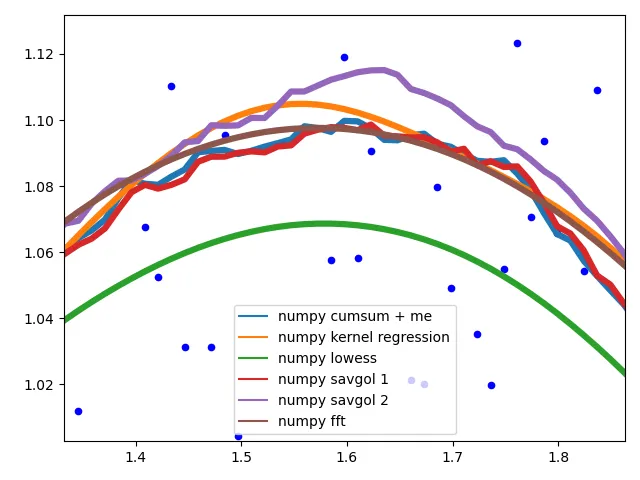
不同的savgol和average滤波器产生粗糙的直线,lowess、fft和kernel regression产生平滑的拟合。当数据变化时,lowess似乎切角。
动机
我有一个树莓派记录数据以供娱乐,可视化证明是一个小挑战。除了RAM使用情况和以太网流量外,所有数据
savgol_filter((x, y), ...)。 - Tim Kuipers