我在这里发布了相当多的代码,它在本帖子的底部。 该代码使用matplotlib打开一个带有各种按钮和字段等的tkinter GUI。 它还在最底部显示一个图表。 我知道这不是最好的库,但我不知道其他库如何与tkinter一起使用。 因此,我最好仍然坚持使用matplotlib。
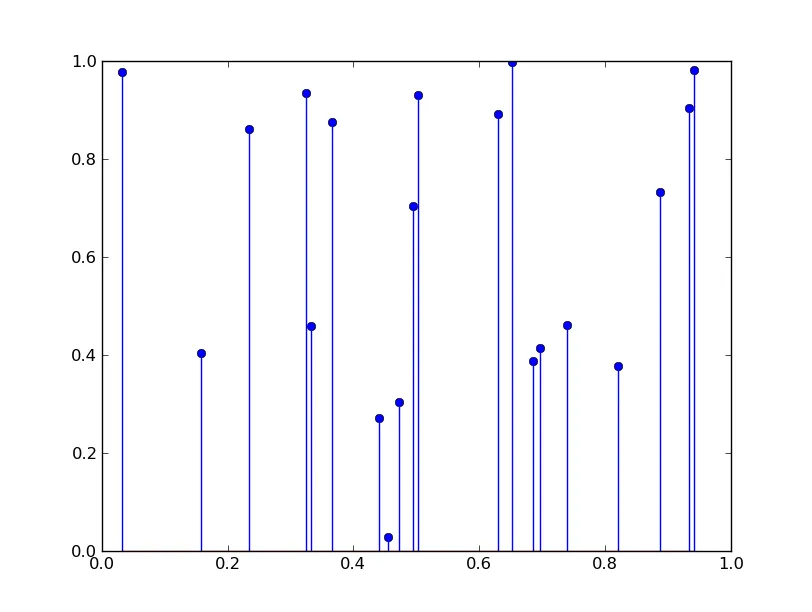
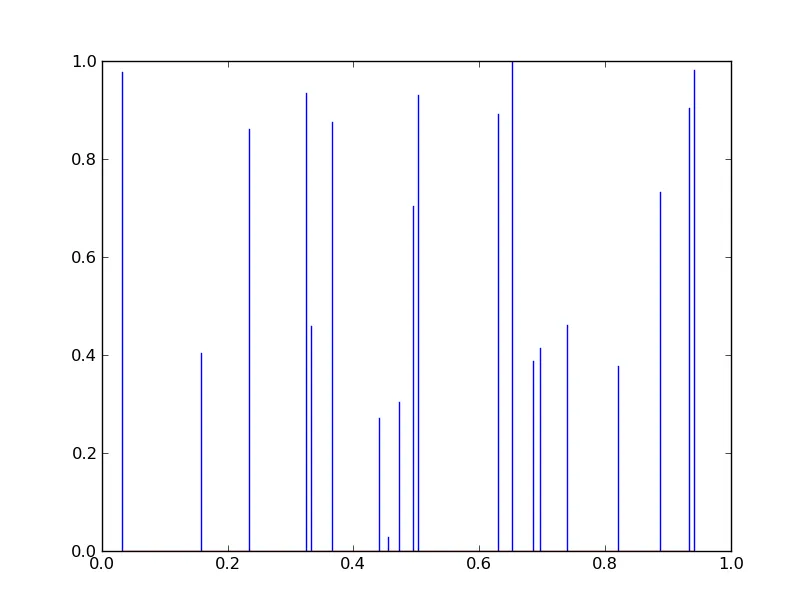
对于图表,我希望每个数据点都可以从[x,y]坐标向下到[x,0]成为垂直线条。 显然的方法是使用具有1个单位宽度的条形图,我已经尝试过这样做,但绘制速度比散点图慢得多。
我一直在努力弄清楚是否可能仅使用此处使用的散点图方法,并绘制到y = 0的垂直线。 这可行吗?
还是应该放弃使用matplotlib并使用pandas或PyQtGraph。 如果是这种情况,是否有任何教程可以展示如何完成此操作? 我曾试图找到一些教程,但没有成功。
非常感谢任何帮助。 我正在使用使用python3.3的pyzo软件包。
对于图表,我希望每个数据点都可以从[x,y]坐标向下到[x,0]成为垂直线条。 显然的方法是使用具有1个单位宽度的条形图,我已经尝试过这样做,但绘制速度比散点图慢得多。
我一直在努力弄清楚是否可能仅使用此处使用的散点图方法,并绘制到y = 0的垂直线。 这可行吗?
还是应该放弃使用matplotlib并使用pandas或PyQtGraph。 如果是这种情况,是否有任何教程可以展示如何完成此操作? 我曾试图找到一些教程,但没有成功。
非常感谢任何帮助。 我正在使用使用python3.3的pyzo软件包。
import numpy
from decimal import *
import tkinter as tk
import numpy as np
from tkinter import *
from matplotlib.backends.backend_tkagg import FigureCanvasTkAgg
from matplotlib.figure import Figure
from tkinter import ttk
import tkinter.scrolledtext as tkst
import spectrum_plot_2 as specplot
import sequencer as seq

class Plot:
    def __init__(self, master, data):

        self.x = np.array(data.spectrum[0])
        self.y = np.array(data.spectrum[1])

        # Create a container
        self.frame = tk.Frame(master)

        self.fig = Figure()
        self.ax = self.fig.add_subplot(111)
        self.line = self.ax.plot(self.x, self.y, '|')


        self.canvas = FigureCanvasTkAgg(self.fig,master=master)
#         self.canvas.show()
        self.canvas.get_tk_widget().pack(side='top', fill='both', expand=1)
        self.frame.pack()

    def update(self, data):
        """Updates the plot with new data"""

        self.x = np.array(data.spectrum[0])
        self.y = np.array(data.spectrum[1])

        self.line[0].set_xdata(self.x)
        self.line[0].set_ydata(self.y)

        self.canvas.show()
        self.frame.pack()


class Spectrum:
    """(Spectrum, String, Decimal, int) -> None
       Import a spectrum from a text file
    """

    def __init__(self, file, precision = 4, charge_state = None, sensetivity = 50, name='Unknown'):

        self.precision = precision
        self.name = name
        self.file = file
        self.charge_state = charge_state
        self.spectrum = self.load_spec(file, precision)


    def load_spec(self, file, precision):
        """(Spectrum, String) -> list
           manipulate spectrum file and return a list of lists:
           list[0] = [mz]
           list[1] = [intensity]
        """

        raw_spectrum = numpy.loadtxt(file)

        # assign the spectrum to a dictionary
        intensity = ['%.0f' % elem for elem in raw_spectrum[:,1]]
        mz = ['%.4f' % elem for elem in raw_spectrum[:,0]]

        spectrum = [mz, intensity]

        for i in spectrum:
            for j, elem in enumerate(i):
                i[j] = round(Decimal(elem), precision)
            j = 0

        return [mz, intensity]


class View(ttk.Frame):
    """Main GUI class"""

    def __init__(self, master = None):

        self.WIDTH = 450
        self.HEIGHT = 500

        self.spectrum = seq.Spectrum(r'C:\MyPyProgs\Sequencer\data\s1c4b1.txt')
        self.spectra = {}
        self.spectra_names = []
        self.filenames = []

        ###############################
        ### User editable variables ###

        self.precision = IntVar(value=4, name='precision')
        self.sensitivity = IntVar(value = 50, name='sensitivity')

        ### User editable variables ###
        ###############################

        # Set up the main window
        ttk.Frame.__init__(self, master, borderwidth=5, width=self.WIDTH, height=self.WIDTH)
        self.master.resizable(FALSE, FALSE)
        self.grid(column=0, row=0, sticky=(N, S, E, W))
        self.columnconfigure(0, weight=1)

        # Create the upper control frame
        self.control_frame = ttk.Frame(self, width=self.WIDTH // 2, height=300, relief='sunken')
        self.control_label = ttk.Label(self.control_frame, text="Controls", font='arial', justify='center')

        # Precision controls definitions
        self.precision_label = ttk.Label(self.control_frame, text="Precision: ")
        self.precision_entry = ttk.Entry(self.control_frame, textvariable=self.precision)
        self.precision_help_button = ttk.Button(self.control_frame, text="Help")

        # Sensitivity controls definitions
        self.sensitivity_label = ttk.Label(self.control_frame, text="Sensitivity")
        self.sensitivity_entry = ttk.Entry(self.control_frame, textvariable=self.sensitivity)
        self.sensitivity_reload = ttk.Button(self.control_frame, text="Reload")
        self.sensitivity_help_button = ttk.Button(self.control_frame, text="Help")

        self.analyse_known_button = ttk.Button(self.control_frame, text="Analyse From Known")

        self.control_frame.grid(row=0, column=1, sticky=(N, E, S))
        self.control_label.grid(column=0, row=0, columnspan=4, sticky=(N), pady=5, padx=self.WIDTH // 5)

        ### Grid layouts ###
        # Precision controls grid
        self.precision_label.grid(column=0, row=1, padx=2)
        self.precision_entry.grid(column=1, row=1, padx=2)
        self.precision_help_button.grid(column=3, row=1, padx=2)

        # Sensitivity controls grid
        self.sensitivity_label.grid(column=0, row=2, padx=2)
        self.sensitivity_entry.grid(column=1, row=2, padx=2)
        self.sensitivity_reload.grid(column=2, row=2, padx=2)
        self.sensitivity_help_button.grid(column=3, row=2, padx=2)

        self.analyse_known_button.grid(column=1, row=3, columnspan=2)


        ### Output frame using ScrolledText ###
        self.output_frame = ttk.Frame(self, relief='sunken')
        self.output_frame.grid(row=0, column=0)

        self.output = tkst.ScrolledText(self.output_frame, width=45, height=20, wrap=WORD)
        self.output.grid(row=0, column=0, sticky=(N, S, E, W))
        self.output.see(END)

        self.output.insert(END, "Welcome, before you start make sure that the backbone and sugar structures are correct.  To analyse your spectra follow the steps below: \n 1. Type the known sequence into the text box from 5' to 3' and click assign.  \n 2. Load your spectra in order of charge, File -> Open Spectra... . \n 3. Finally click the Analyse From Known button.  \n")
        self.output['state']='disabled'

        ### Creates a sunken frame to get the sequence and choose loaded spectra ###
        self.input_frame = ttk.Frame(self, relief='sunken', borderwidth=5, width=self.winfo_width())
        self.input_frame.grid(row=1, column=0, columnspan=2, sticky=(E, W))

        self.spec_label = ttk.Label(self.input_frame, text="Spectrum:")
        self.selected_spec = StringVar()
        self.spec_select = ttk.Combobox(self.input_frame, values=self.spectra_names)

        self.spec_label.grid(row=0, column=6, padx=10)
        self.spec_select.grid(row=0, column=7)

        seq_entry_label = ttk.Label(self.input_frame, text="Sequence: ")
        label_5p = ttk.Label(self.input_frame, text="5'-")
        self.sequence_entry = ttk.Entry(self.input_frame, width=40)
        label_3p = ttk.Label(self.input_frame, text="-3'")
        assign_seq = ttk.Button(self.input_frame, text="Calculate", command=lambda : self.assign(self.sequence_entry))

        seq_entry_label.grid(row=0, column=0)
        label_5p.grid(row=0, column=1)
        self.sequence_entry.grid(row=0, column=2)
        label_3p.grid(row=0, column=3)
        assign_seq.grid(row=0, column=4)

        ### Creates a sunken frame to plot the current spectrum ###
        self.spec_frame = ttk.Frame(self, relief='sunken', borderwidth=1, width=self.winfo_width(), height=250)
        self.spec_frame.grid(row=2, column=0, columnspan=2, sticky=(S, E, W))

        self.plot = specplot.Plot(self.spec_frame, self.spectrum)

precision = 4
charge = -1
file = r'C:\MyPyProgs\sequencer\data\s1c4b1.txt'
spectrum = Spectrum(file, precision, charge)


if __name__ == "__main__":
    root = Tk()
    root.title("Sequencer_help")
    view = View(root)
    root.mainloop()
    print("End")