我正在按照这篇教程进行学习。
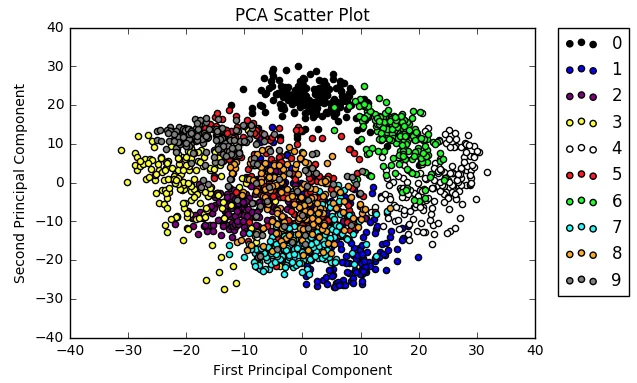
我想使用Matplotlib创建一个散点图,内部有颜色,但边框是黑色的,就像这张图片:
然而,当我复制了代码后,我得到的却是这样的图表。

以下是代码:
colors = ['black', 'blue', 'purple', 'yellow', 'white', 'red', 'lime', 'cyan', 'orange', 'gray']
for i in range(len(colors)):
    x = reduced_data_rpca[:, 0][digits.target == i]
    y = reduced_data_rpca[:, 1][digits.target == i]
    plt.scatter(x, y, c=colors[i])
plt.legend(digits.target_names, bbox_to_anchor=(1.05, 1), loc=2, borderaxespad=0.)
plt.xlabel('First Principal Component')
plt.ylabel('Second Principal Component')
plt.title("PCA Scatter Plot")
plt.show()
我尝试调整样式,但那没什么帮助。
marker='o'但你没有提供可运行的示例。 - roganjoshedgecolors="black"这个参数。 - Mr. T