在Matlab中将曲线拟合到特定颜色的区域

4
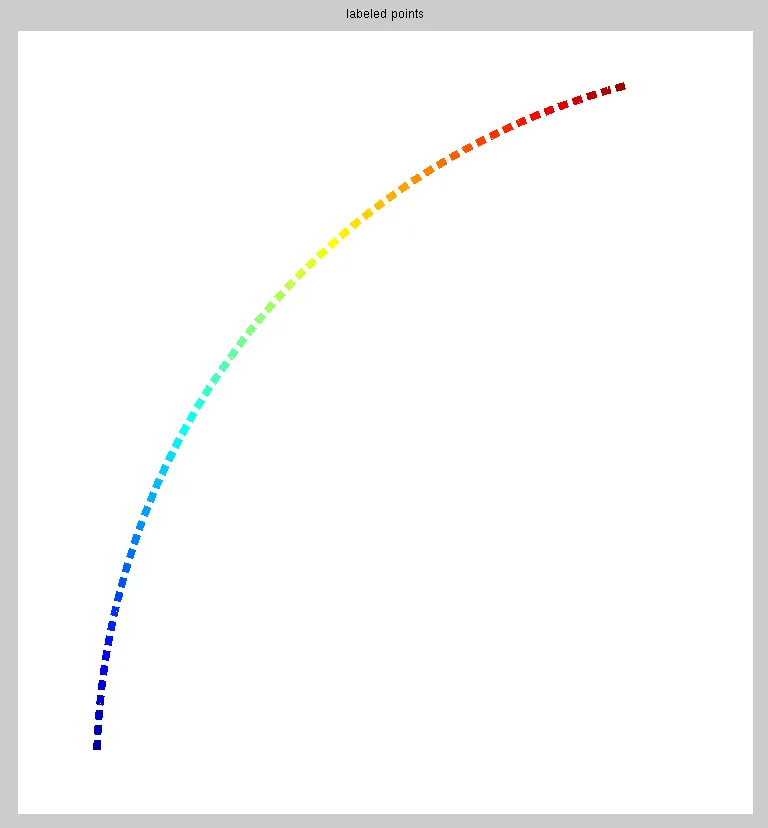
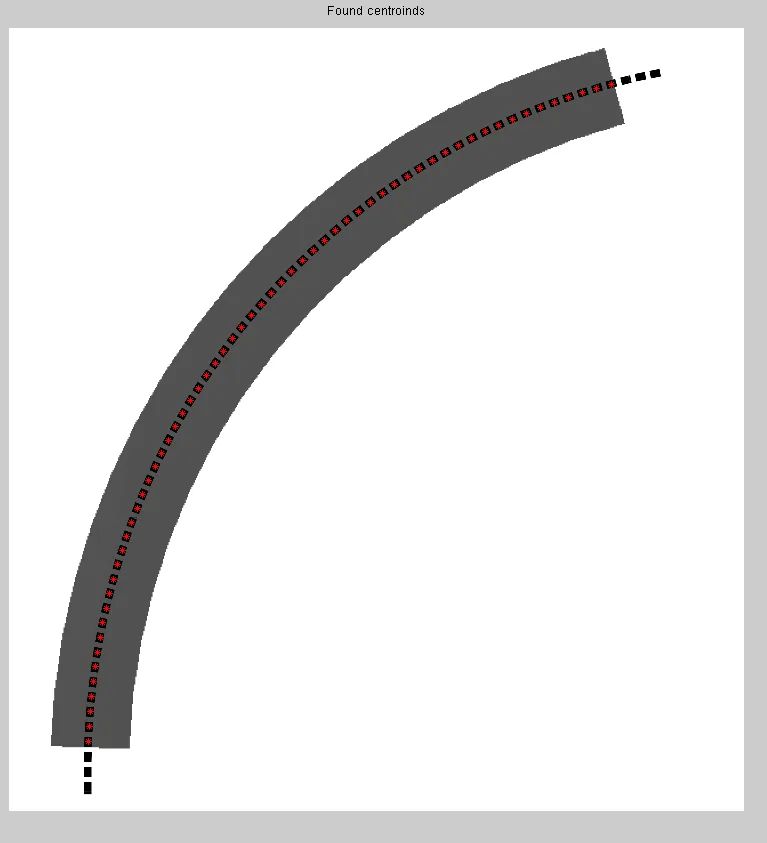
我正在尝试使用像素的颜色在图像的特定区域上拟合曲线。如图所示(https://db.tt/PcxHGbT3),图像中有一个可以通过Matlab图像处理检测到的灰色区域。一旦我使用以下Matlab代码找到像素的位置:
im = imread('layer.jpg');
figure,imshow(im);title('Original Image');
[y,x] = find(all(im<100, 3));

我需要找到位于图像(https://db.tt/PcxHGbT3)所示区域中心线上的点的位置。我想着用某种方式拟合曲线,但我不知道如何在Matlab中实现这一点。除了处理所有点之外,是否有其他更短的方法?

2个回答

0

您可以使用Matlab二进制图像操作来获取灰色区域内点的质心。有了质心,您可以对它们进行任何操作,例如拟合线条。这是一个基于您的图像的示例,说明如何完成此操作。

% convert rgb to gray scale
im = rgb2gray(imread('layer.jpg'));

% mask of gray-color with points
bwMask1 = im < 100; 

% mask with points only
bwMask2 = im < 20;  

% remove points outside gray area
bwMask3 = bwareaopen(bwMask1, 400);

% points only withing gray ![enter image description here][1]area
bwMask4 = bwMask2 & ~(bwMask3 - bwMask2);

% label all points
[L] = bwlabel(bwMask4, 8);

% calculate points parameters
pointStats = regionprops(L);

% get centroids of each point
pointCentroidsCell = {pointStats(:).Centroid};
pointCentroidsMat  = vertcat(pointCentroidsCell{:});


%plot results:
RGB = label2rgb(L); 
figure, imshow(RGB); title('labeled points');
![enter image description here][2]
figure,imshow(im); hold on;
plot(pointCentroidsMat(:, 1), pointCentroidsMat(:, 2), 'r*');
title('Found centroinds');

enter image description here enter image description here


非常感谢你的回答。我在这张图片上尝试了你的代码:https://db.tt/Z1za9o1L,但是它没有起作用。你能否请再确认一下? - NESHOM
@user114781它不起作用是因为上面没有点。在你问题中提供的两个示例中都有点。所以我猜,通常根本没有点? - Marcin
抱歉造成困惑。图像中的那些点是我要查找的点。我只是展示它们以澄清我正在寻找该区域的中心线。通常所有照片都以https://db.tt/Z1za9o1L的形式呈现。如果您有其他解决方案,请告诉我。 - NESHOM

0
你可以使用 im2bw(im,100/256) 对图像进行阈值处理,然后使用bwmorph(BW,'thin',INF)对结果进行细化吗?

谢谢您的评论。但无论结果多么细,仍然会有几个像素点的宽度。我如何找到中心点呢? - NESHOM
如果您将Inf传递给thin操作,则结果应该只有一个像素宽。这不足够吗? - Chris Culter
谢谢您的回复。我尝试了一下,这是结果:https://db.tt/wpYa8Keg - 如您所见,两端有一些额外的行。我应该手动删除它们吗?还是有更好的方法可以摆脱它们? - NESHOM

网页内容由stack overflow 提供, 点击上面的
可以查看英文原文,
原文链接